 By Oliver Awa. Updated Oct 12, 2024. 1st
Published on Oct
12, 2022
Learn more about
Oliver
Performance monitoring and alerting are very crucial to measure the performance metrics of an application running in a production environment. In this project, you will create a metrics collection and graphing system. This will allow you to visually see what the system utilization is for a given host or across an entire environment. You will be installing two popular open-source tools known as Prometheus and Grafana alongside a Node_exporter. You will then use it to monitor servers running in our environment
Before we deve deep into the project, lets define some important terms
1.Jenkins
Jenkins is an open-source automation server
used to automate tasks associated with building, testing, and
delivering/deploying software.
3.Terraform
Terraform is a tool for building, changing, and
versioning infrastructure that has an open-source and enterprise
version.
This tutorial we will walks you through the process of deploying a VPC and it associate subnet in an aws environment. You will launch an EC2 instance, install Jenkins on that instance, and configure Jenkins to automatically spin up Jenkins agents if build abilities need

Architect Jenkins Pipeline
Jenkins Pipeline:- supports Continuous Integration and Continuous Deployment by automating all the steps like build, testing, and deploying. This can be achieved with a Jenkins file which will be committed to GitHub or any project’s code repository.
Jenkins file:-The Jenkins file contains the definition of the pipeline with multiple stages where each stage represents a task or set of tasks to be performed. I will explain each stage individually later in this article.
GitHub:-We used GitHub as our code repository for this project. we committed all our code to the main branch.
Terraform:-Terraform is a free open-source infrastructure as a code tool that can create, change and improve the infrastructure. we used it to automate the process of creating a vpc and it associate subnets in our aws cloud environment.
Before we move on to lunch an Ec2 instance, install and configure jenkins and
its
plugin ,
we need to make sure that our terraform code function perfectly.
If you are
new
to terraform, please follow up with
this tutorial
to
set
up, write and Deploy
terraform code in your cloud environment manually. Your can
as well fork
the
repository.
from our github account . If that is what you intend to do , Please make sure
you
create and match your s3
bucket name with that in the terraform code.
Once that is done, your are
ready
to procced with the automation process.
With above the Prerequisites in place, we will move straight to install and
configure
Jenkins on the ec2 instance running
in our cloud environment. if you need help lunching an ec2 instance, check out
this
tutorial.
Please, make sur that port 22 and 8080 are open and that you can ssh into your
ec2
instance.
To facilitate things, you can insert Jenkins installation script as user data (User data script is the easiest and most popular way to send instructions to an instance at launch.) while lunching an aws EC2 Instance. if you choose to do so, here is the installation script.
                                                                #!/bin/bash
                                                                sudo yum update –y
                                                                sudo wget -O /etc/yum.repos.d/jenkins.repo \
                                                                https://pkg.jenkins.io/redhat-stable/jenkins.repo
                                                                sudo rpm --import https://pkg.jenkins.io/redhat-stable/jenkins.io-2023.key
                                                                sudo yum upgrade
                                                                sudo dnf install java-17-amazon-corretto -y
                                                                sudo yum install jenkins -y
                                                                sudo systemctl enable jenkins
                                                                sudo systemctl start jenkins
You can check the status of the Jenkins service using the command:
sudo systemctl status jenkins sudo yum update –ysudo wget -O /etc/yum.repos.d/jenkins.repo \
https://pkg.jenkins.io/redhat-stable/jenkins.repo sudo rpm --import https://pkg.jenkins.io/redhat-stable/jenkins.io-2023.key sudo yum upgradesudo dnf install java-17-amazon-corretto -y sudo yum install jenkins -y sudo systemctl enable jenkins sudo systemctl start jenkinsYou can check the status of the Jenkins service using the command:
sudo systemctl status jenkinsJenkins is now installed and running on your EC2 instance. To configure Jenkins:
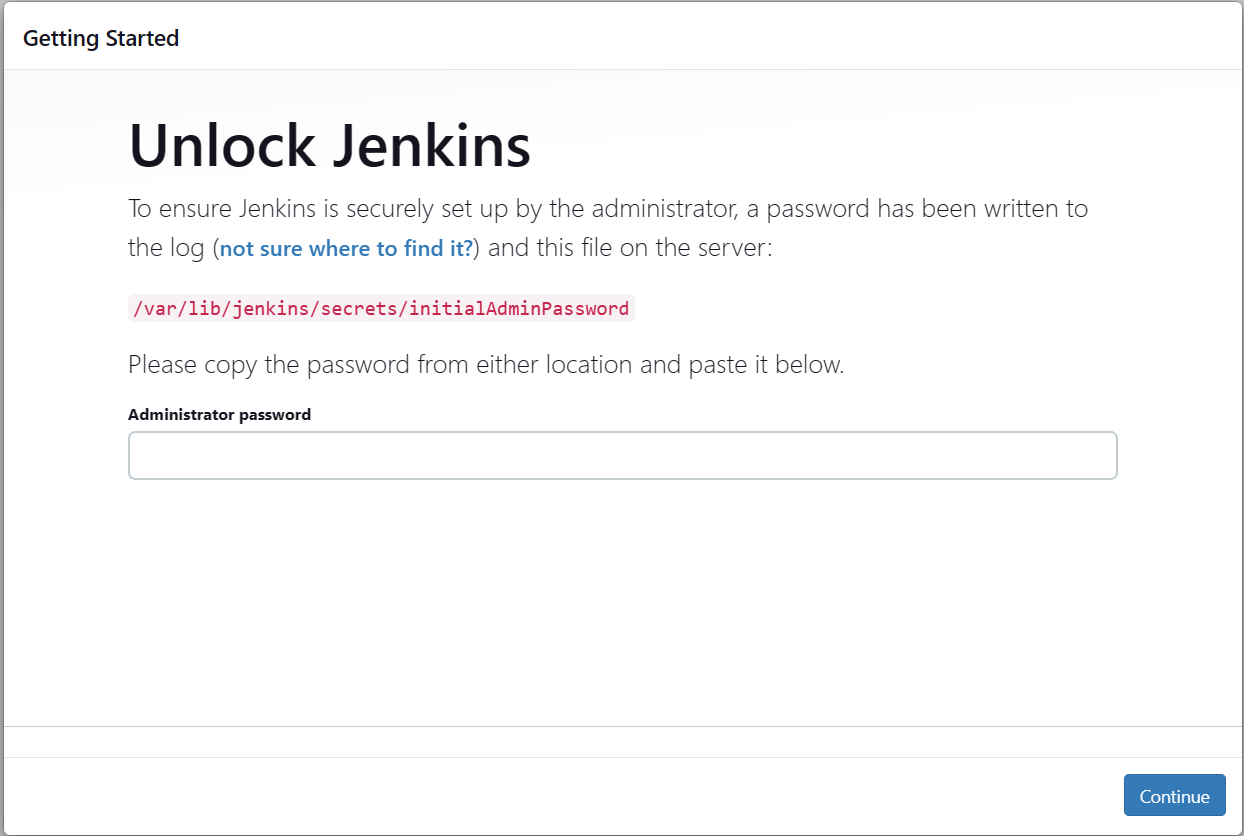
sudo cat /var/lib/jenkins/secrets/initialAdminPassword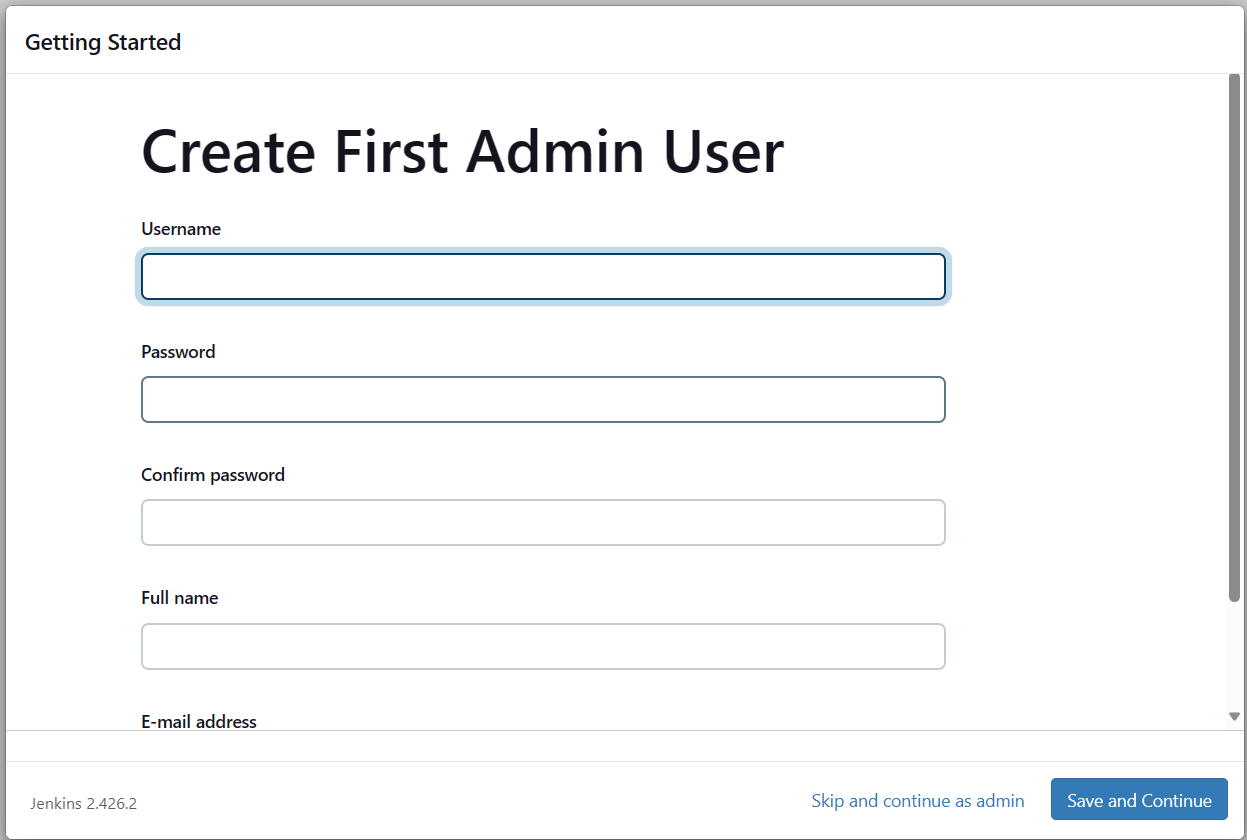
Using the link you save above, sign into Jenkins and follow the various stept to configure terraform on Jenkins
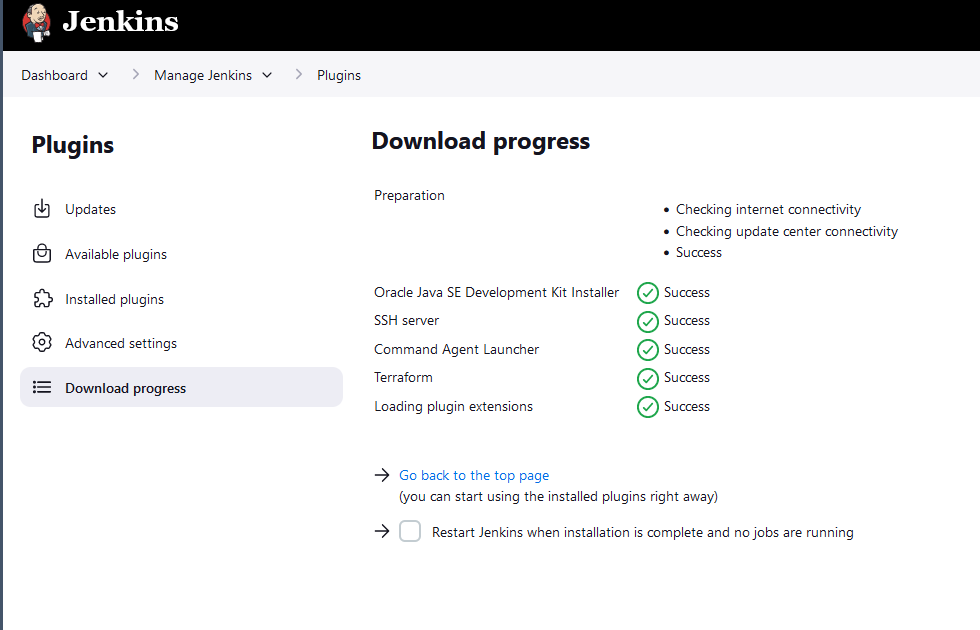
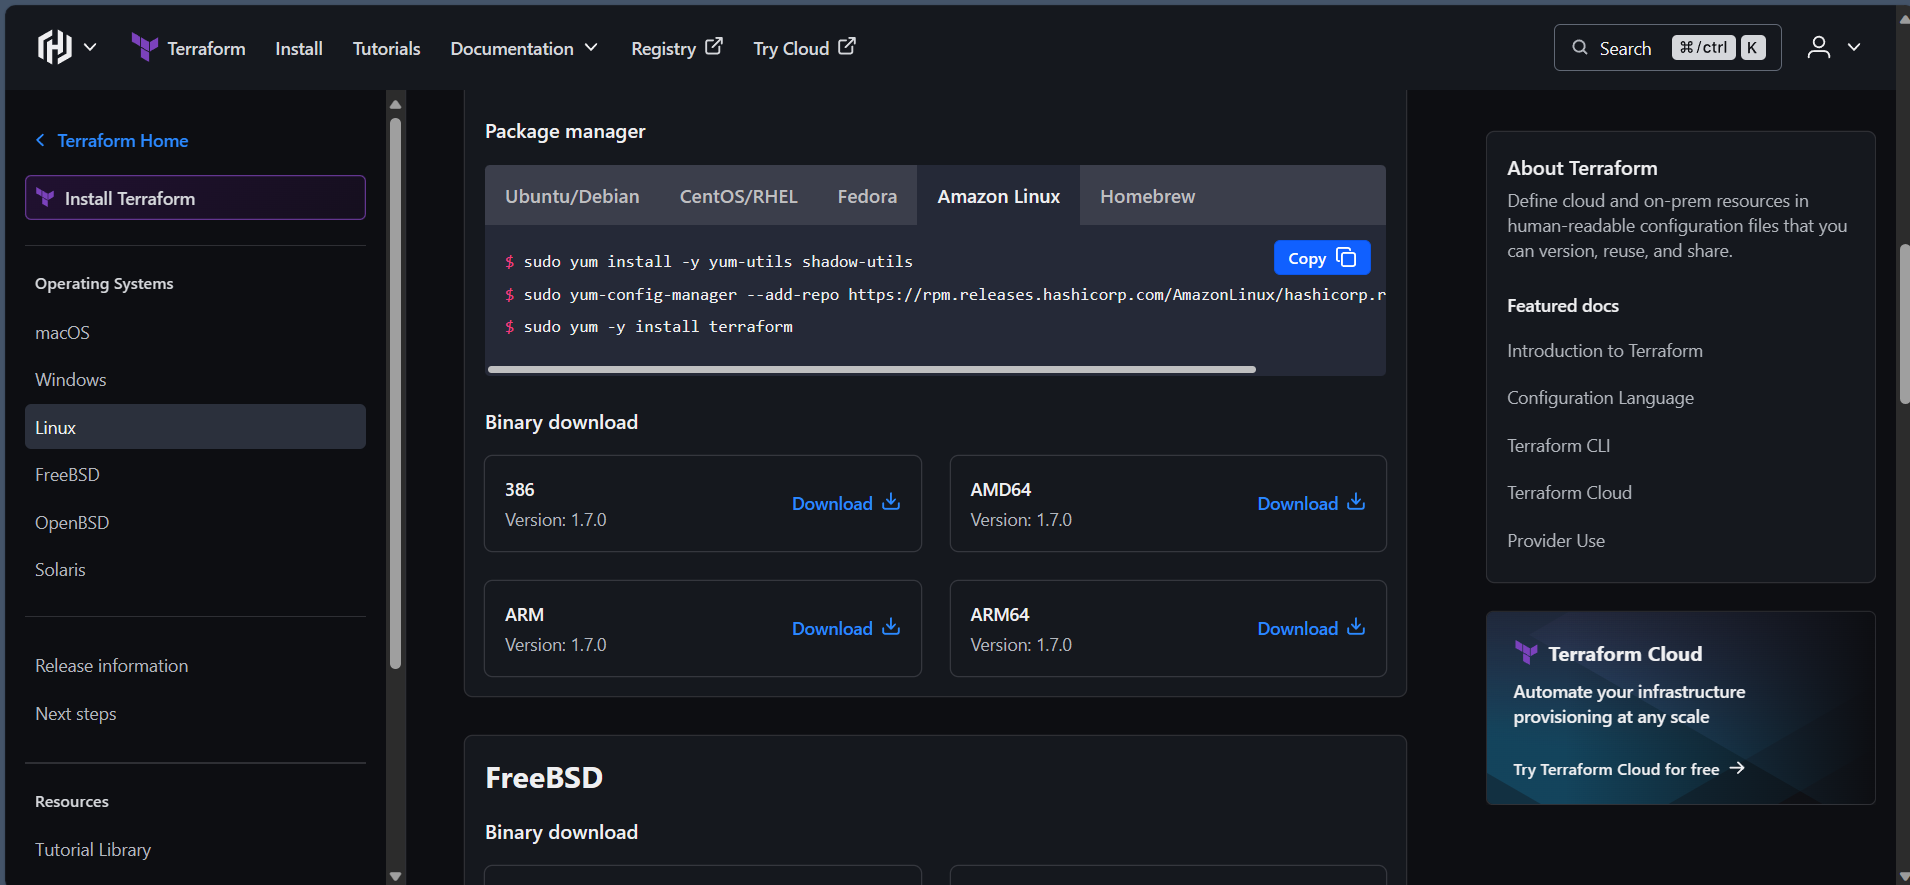
wget (copied url)ls you should see a Terraform zip file.
Run
unzip {terraform zip file name}.
sudo mv terraform /usr/bin
which terraform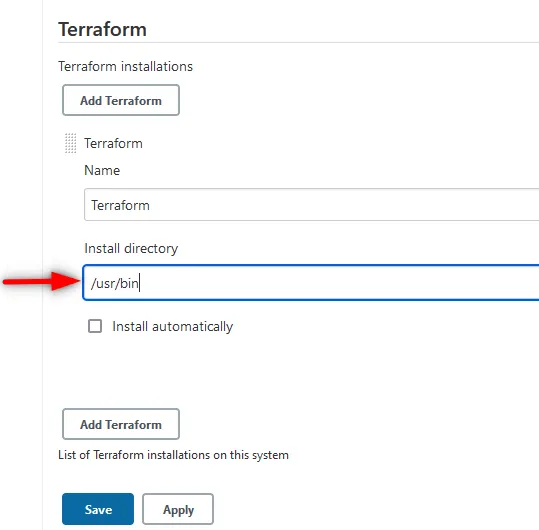
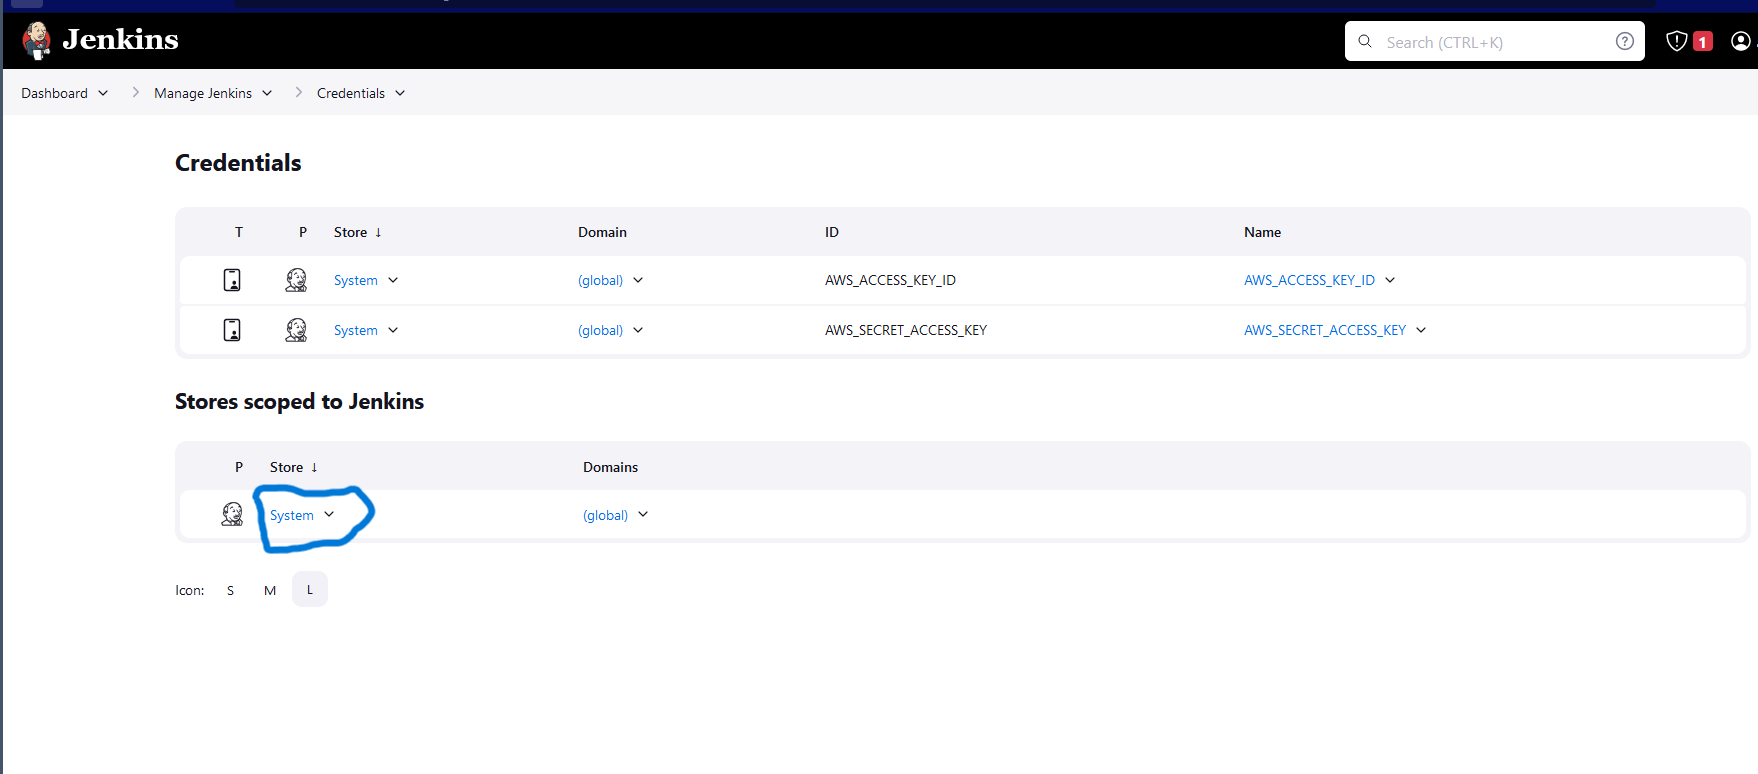
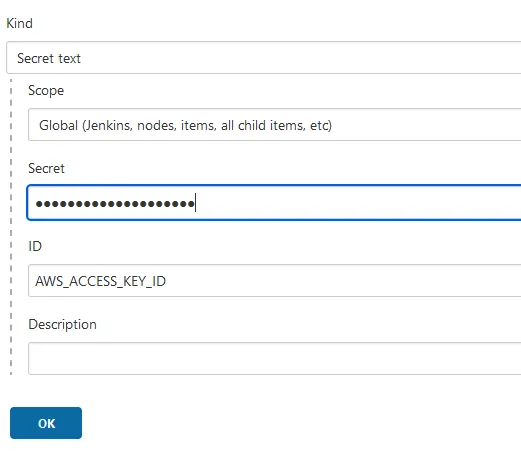
Before we configure Jenkins Pipeline, we need to have a Jenkinsfile in the root directory of our project residing in github. let us create one now
A Jenkinsfile is a text file that defines the entire build process for a Jenkins pipeline. It uses a domain-specific language (DSL) that is based on Groovy syntax. Writing a Jenkinsfile involves defining stages, steps, and other configuration elements to automate the build, test, and deployment processes.
Pipeline supports two syntaxes, Declarative (introduced in Pipeline 2.5) and Scripted
Declarative Syntax: This is a more structured
and
human-readable approach and usually structured as seen below
The agent instructs Jenkins to allocate an executor and workspace for the
Pipeline.
Without an agent directive, not only is the Declarative Pipeline not valid,
it would not be capable of doing any work! By default the agent directive
ensures
that the source repository is checked
out and made available for steps in the subsequent stages.
The stages directive, and steps directives are also required for a valid
Declarative
Pipeline as they instruct Jenkins
what to execute and in which stage it should be executed.
                                Jenkinsfile (Declarative Pipeline)
                                pipeline {
                                    agent any
                                    //Specify the agent (where the build run)
                                    //e.g, 'docker', 'node', 'any', etc

                                    stages {
                                        stage('Build') {
                                            steps {
                                                //Define steps for the 'Build stage'
                                                //source code is assembled, compiled, or packaged


                                            }
                                        }
                                        stage('Test') {
                                            steps {
                                                //Define steps for the 'Test stage'
                                            }
                                        }

                                        //Add more stages as needed

                                        stage('Deploy') {
                                            steps {
                                                //Define the deployment step
                                            }
                                        }

                                        Post {
                                            //Define post-biuld action, such as notification oe clean
                                        }
                                    }
                                }
Scripted Syntax: With the Scripted Pipeline,node is a crucial first step as it allocates an executor and workspace for the Pipeline. In essence, without node, a Pipeline cannot do any work! From within node, the first order of business will be to checkout the source code for this project. sample structured seen below
                                    node {
                                    checkout scm
                                    //The checkout step will checkout code from source control
                                    //scm is a special variable which instructs the checkout step to clone the specific revision which triggered this Pipeline
                                    run.
                                    /* .. snip .. */
                                    }
you can check out how to set environment variable and Handle credentials within Jenkins Here
Check out the jenkinsfile use for this project in the our GitHub Repo
The goal for this project is to create a centralized syslog server that will allow you to store, graph, and search through the syslog messages from multiple servers. To do this, you'll be deploying the ELK stack. The components of the ELK stack are Elasticsearch, Logstash, and Kibana. Finally, you'll configure servers to send their messages to this new system.
The ELK Stack fulfills a need in the log analytics space. As more and more of your IT infrastructure move to public clouds, you need a log management and analytics solution to monitor this infrastructure as well as process any server logs, application logs, and clickstreams. The ELK stack provides a simple yet robust log analysis solution for your developers and DevOps engineers to gain valuable insights on failure diagnosis, application performance, and infrastructure monitoring – at a fraction of the price.
In computing, logging is the act of keeping a log of events that occur in a computer system, such as problems, errors or just information on current operations. These events may occur in the operating system or in other software. A message or log entry is recorded for each such event. These log messages can then be used to monitor and understand the operation of the system, to debug problems, or during an audit. Logging is particularly important in multi-user software, to have a central overview of the operation of the system.
In the simplest case, messages are written to a file, called a log file. Alternatively, the messages may be written to a dedicated logging system or to a log management software, where it is stored in a database or on a different computer system.
Syslog is the de facto UNIX networked logging standard, sending messages from client machines to a local file, or to a centralized log server via rsyslog.
Linux has a dedicated service known as Syslog that is specifically responsible for creating logs via the System Logger. Syslog comprises of several components such as the Syslog Message Format, Syslog Protocol, and the Syslog Daemon: popularly known as syslogd or rsyslogd in newer versions of Linux.
The syslog protocol provides a message format defined by the RFC 5424 standard. In this format, common event information is defined, such as the timestamp, hostname, and the name of the application that produced the message. To further support the structuring of this message, syslog facilities are available to denote which part of the system the log comes from. This is done by attaching a number to the message. Below is a list of all available facilities, numbered from 0 to 23:
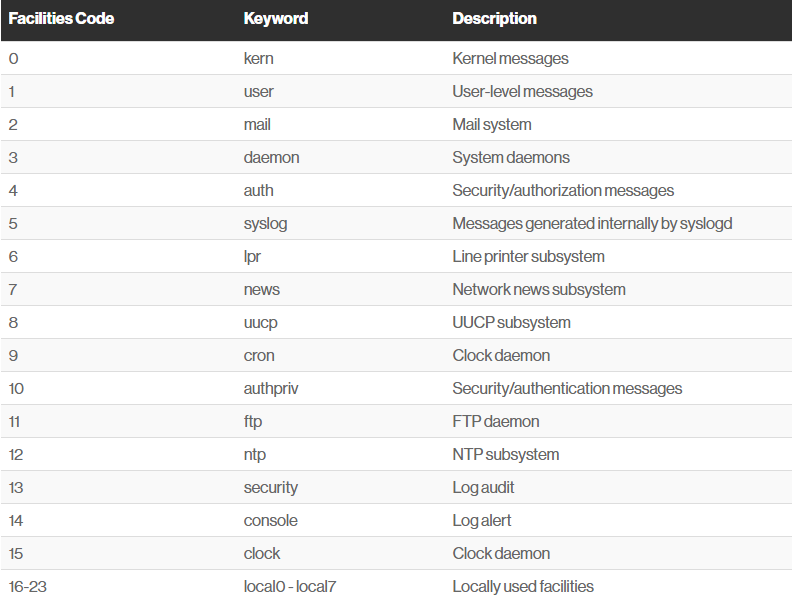
Figure syslog facilities
Similarly, priority can be attached to a message using a number between 0 and 7
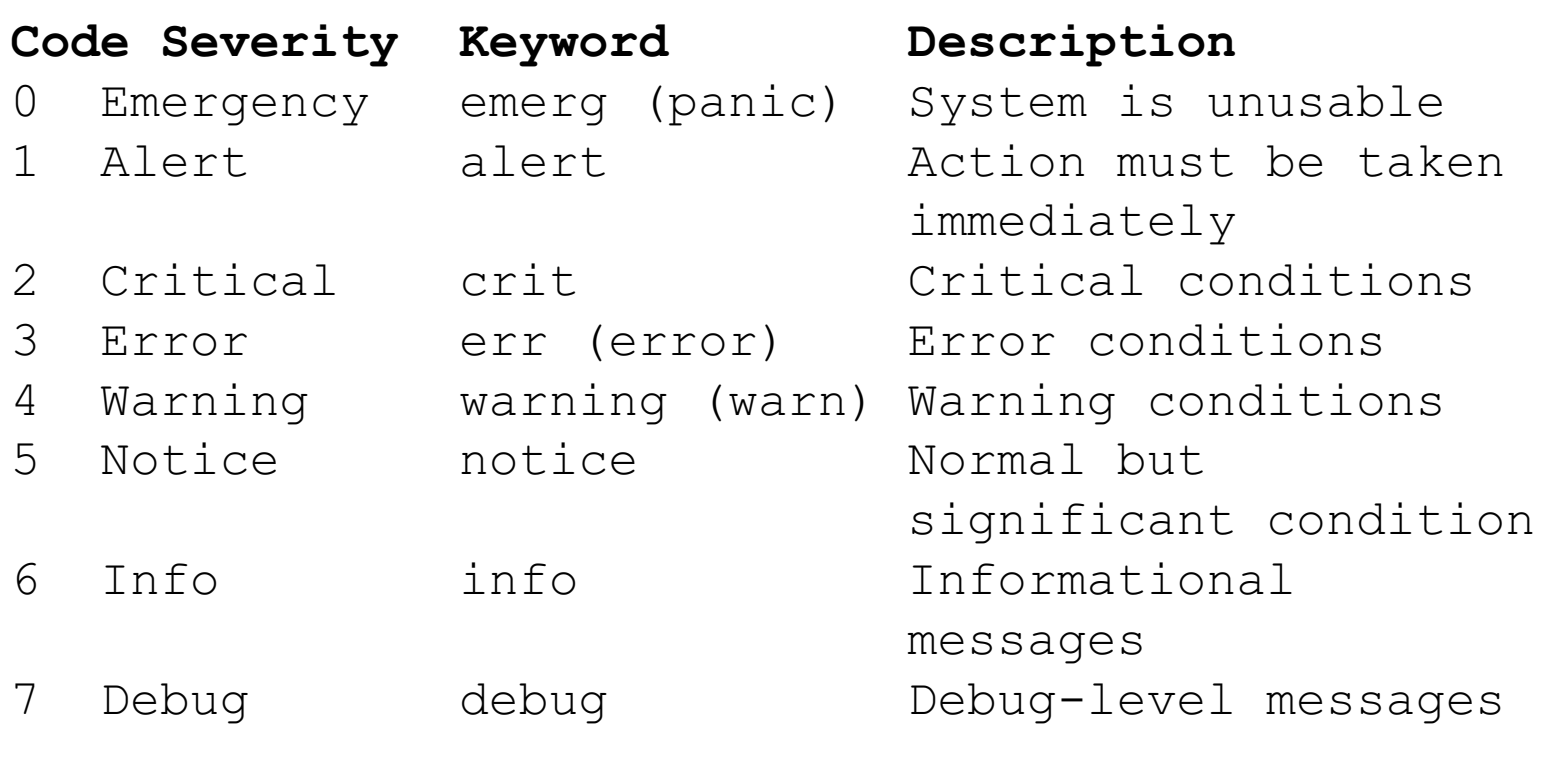
Figure syslog priority
The syslog process runs as a daemon on the system to receive, store, and interpret syslog messages from other services or applications. That service typically listens on port 514 for TCP and 601 for UDP connections. Many applications allow you to configure their event logging to push messages to a running syslog service.
The rsyslog daemon runs as a service on your host, listening for log messages sent to it and routing those messages based on defined actions.
In a typical installation of rsyslog, the daemon is configured through a file located at /etc/rsyslog.conf . In this config file, using selectors for the facilities and priority of the log message allows you to define what action should be carried out for the message.
In the following example, any messages with the facility of mail and a priority of notice or higher will be written to a log file located at /var/log/mail_errors.
                                                                                    1. # .
                                                                                    2. mail.notice /var/log/mail_errors
These selectors are structured by facility (origin of the message) and priority (severity of the message), separated by a dot. The example below shows some possibilities of using this simple configuration to perform actions on incoming logs.
# Log a message to file
                                                      mail.notice /var/log/mail_errors


                                                      # Log a message to a user


                                                      Kern.debug bob
                                                      # Emergency messages from any facility should go to all users
                                                      *.emerg *


                                                      # Log a message to another host over UDP
                                                      *.* @remote-host


                                                      # Log a message to another host over TCP
                                                      *.* @@remote-host:514
let’s see a couple of utilities that you can use in case you want to log messages.
The logger utility is probably one of the simpliest log client to use. Logger is used in order to send log messages to the system log and it can be executed using the following syntax.
$ logger Let’s say for example that you want to send an emergency message from the auth facility to your rsyslog utility, you would run the following command.
logger -p auth.emerg "Somebody tried to connect to the system"
Now if you were to inspect the /var/log/auth.log file, you would be able to find the message you just logged to the rsyslog server.
$ tail -n 10 /var/log/auth.log | grep --color connectIn a system that generates several logs, the administration of such files can be greatly simplified using logrotate. it will automatically rotate, compress, remove, and mail logs on a periodic basis or when the file reaches a given size.
A syslog server is where system logs are centralized, making it easier to manage and monitor them. Syslog servers allow you to collect your error logs and system logs in one place, and you can coordinate and combine logs from across different systems.
Centralizing logs in one place is ensential. Doing so can benefit you in the following ways
We will create a centralized rsyslog server to store log files from multiple systems and then use Logstash to send them to an Elasticsearch server. From there, will use Kibana to analyze the data.
From a centralized, or aggregating rsyslog server, you can then forward the data to Logstash, which can further parse and enrich your log data before sending it on to Elasticsearch.

Figure Centralized syslog system
The ELK stack is an acronym used to describe a stack that comprises of three popular projects: Elasticsearch, Logstash, and Kibana. Often referred to as Elasticsearch, the ELK stack gives you the ability to aggregate logs from all your systems and applications, analyze these logs, and create visualizations for application and infrastructure monitoring, faster troubleshooting, security analytics, and more.
Logstash is a light-weight, open-source, server-side data processing pipeline that allows you to collect data from a variety of sources, transform it on the fly, and send it to your desired destination. It is most often used as a data pipeline for Elasticsearch, an open-source analytics and search engine. Because of its tight integration with Elasticsearch, powerful log processing capabilities, and over 200 pre-built open-source plugins that can help you easily index your data, Logstash is a popular choice for loading data into Elasticsearch.
Logstash allows you to easily ingest unstructured data from a variety of data sources including system logs, website logs, and application server logs.
Elasticsearch is a distributed search and analytics engine built on Apache Lucene. Since its release in 2010, Elasticsearch has quickly become the most popular search engine and is commonly used for log analytics, full-text search, security intelligence, business analytics, and operational intelligence use cases.
you can send data in the form of JSON documents to Elasticsearch using the API or ingestion tools such as Logstash and Amazon Kinesis Firehose. Elasticsearch automatically stores the original document and adds a searchable reference to the document in the cluster’s index. You can then search and retrieve the document using the Elasticsearch API. You can also use Kibana, a visualization tool, with Elasticsearch to visualize your data and build interactive dashboards.
Kibana is a data visualization and exploration tool used for log and time-series analytics, application monitoring, and operational intelligence use cases. It offers powerful and easy-to-use features such as histograms, line graphs, pie charts, heat maps, and built-in geospatial support. Also, it provides tight integration with Elasticsearch, a popular analytics and search engine, which makes Kibana the default choice for visualizing data stored in Elasticsearch.
The ELK Stack fulfills a need in the log analytics space. As more and more of your IT infrastructure move to public clouds, you need a log management and analytics solution to monitor this infrastructure as well as process any server logs, application logs, and clickstreams. The ELK stack provides a simple yet robust log analysis solution for your developers and DevOps engineers to gain valuable insights on failure diagnosis, application performance, and infrastructure monitoring – at a fraction of the price.
The vagrant box: "jasonc/centos8" will be use to boot up this machine.
Open the command prompt or terminal and create a project directory with the command below.
mkdir linuxclass Move into the folder or directory we just created by runing the command:
cd linuxclassInitialize the vagrant project using the usual process of creating a directory, changing into that directory, and running "vagrant init". We'll name this vagrant project "elk_stack".
                                                                                      mkdir elkstack
                                                                                      cd elkstack
                                                                                      vagrant init jasonc/centos8
open and modified the vagrantfile by adding a hostname and an IP address to the server as seen below
                                                                                        config.vm.hostname = "elkstack"
                                                                                        config.vm.network "private_network", ip: "10.23.45.90"
Boot up the virtual machine, check the status and ssh into the machine with the following command>
                                                                                      vagrant up
                                                                                      vagrant status
                                                                                      vagrant ssh
We'll be using Elasticsearch to store the syslog messages. Let's install Elasticsearch from an RPM.
Before you install Elasticsearch, run the command below to install java in centos8
sudo dnf install java-11-openjdk-develAll packages are signed with the Elasticsearch signing key in order to protect your system from package spoofing. Packages which have been authenticated using the key will be considered trusted by your package manager. In this step, you will import the Elasticsearch public GPG key and add the Elastic package source list in order to install Elasticsearch.
Execute the following command on command line or terminal to import GPG key in centOS 8:
sudo rpm --import https://artifacts.elastic.co/GPG-KEY-elasticsearchFirst, Open text editor and create the repository file the /etc/yum.repos.d by executing the following command on command line or terminal:
sudo nano /etc/yum.repos.d/elasticsearch.repoThen paste the following content into the file, save and exit:
                                                        [elasticsearch-7.x]
                                                        name=Elasticsearch repository for 7.x packages
                                                        baseurl=https://artifacts.elastic.co/packages/7.x/yum
                                                        gpgcheck=1
                                                        gpgkey=https://artifacts.elastic.co/GPG-KEY-elasticsearch
                                                        enabled=1
                                                        autorefresh=1
                                                        type=rpm-md
And your repository is ready for use. You can now install Elasticsearch with this commands:
sudo dnf install elasticsearch We need to give our Elasticsearch cluster a name. Also, let's use our hostname for the node name. Edit the elasticsearch.yml file.
sudo nano /etc/elasticsearch/elasticsearch.yml Append the following contents to the bottom of the file and save it.
                                                                                  cluster.name: elkstack
node.name: elkstack Reboot the system for the changes to take effect:
sudo rebootNow we can start and enable the Elasticsearch service.
                                                        sudo systemctl start elasticsearch.service
                                                        sudo systemctl enable elasticsearch.service
Execute the following command on command line or terminal to view the Elasticsearch server configuration and version details:
Give Elasticsearch a minute or two to start. Then connect to its port of 9200 over HTTP using curl.
curl http://localhost:9200 or curl -X GET "localhost:9200"
                                                        {
                                                          "name" : "elkstack",
                                                          "cluster_name" : "elkstack",
                                                          "cluster_uuid" : "gYkxAAbcSdqQ53ZJws3tAQ",
                                                          "version" : {
                                                            "number" : "7.17.9",
                                                            "build_flavor" : "default",
                                                            "build_type" : "rpm",
                                                            "build_hash" : "ef48222227ee6b9e70e502f0f0daa52435ee634d",
                                                            "build_date" : "2023-01-31T05:34:43.305517834Z",
                                                            "build_snapshot" : false,
                                                            "lucene_version" : "8.11.1",
                                                            "minimum_wire_compatibility_version" : "6.8.0",
                                                            "minimum_index_compatibility_version" : "6.0.0-beta1"
                                                          },
                                                          "tagline" : "You Know, for Search"
                                                        }
Let's install Logstash, so we have a way of receiving logs from systems and sending them to Elasticsearch. Logstash is a Java application,so we'll need to install Java. we already install java
Like other parts of the ELK stack, Logstash uses the same Elastic GPG key and repository.
To install logstash on CentOS 8, in a terminal window enter the command:
sudo dnf install logstash Type Y and hit Enter to confirm the install.
Let's create the Logstash configuration. We'll place it in a file named elkstack.conf the /etc/logstash/conf.d directory.
sudo nano /etc/logstash/conf.d/elkstack.confPaste the following contents into the file and save it. Be sure that all the characters pasted correctly. it should apears as seen below
                                                          input {
                                                            syslog {
                                                              type => syslog
                                                              port => 5141
                                                            }
                                                          }
                                                          filter {
                                                            if [type] == "syslog" {
                                                              grok {
                                                                match => { "message" => "Accepted %{WORD:auth_method} for %{USER:username} from %{IP:src_ip} port %{INT:src_port} ssh2" }
                                                                add_tag => "ssh_successful_login"
                                                                }
                                                              grok {
                                                                match => { "message" => "Failed %{WORD:auth_method} for %{USER:username} from %{IP:src_ip} port %{INT:src_port} ssh2" }
                                                                add_tag => "ssh_failed_login"
                                                              }
                                                              grok {
                                                                match => { "message" => "Invalid user %{USER:username} from %{IP:src_ip}" }
                                                                add_tag => "ssh_failed_login"
                                                              }
                                                            }
                                                            geoip {
                                                              source => "src_ip"
                                                            }
                                                          }
                                                          output {
                                                            elasticsearch { }
                                                          }
The input section of the configuration causes Logstash to listen for syslog messages on port 5141. The filter section of the configuration allows Logstash to perform a bit of processing on the messages it receives that match the given patterns. For example, it extracts the authentication method, the username, the source IP address, and source port for ssh connection attempts. It also tags the messages with "ssh_successful_login" or "ssh_failed_login". This will make searching for data based on username, IP address, failed ssh login attempts, etc, quick and efficient. The output section tells logstash to store the messages into the Elasticsearch instance we just created.
Now we can start and enable the logstash service.
                                                            sudo systemctl start logstash
                                                            sudo systemctl enable logstash
Logstash can take several seconds to start. You can confirm it started by looking at its log file.
cat /var/log/logstash/logstash-plain.log Next, let's configure our local system to forward its syslog messages to Logstash. To do that, let's create a logstash.conf file in the /etc/rsyslog.d
sudo nano /etc/rsyslog.d/logstash.conf Place the following contents in the file and save the file.
*.* @10.23.45.90:5141This will cause rsyslog to send a copy of every syslog message to Logstash. Restart rsyslog to enable this configuration.
sudo systemctl restart rsyslogLogstash should now be receiving syslog messages from the local system and storing them in Elasticsearch. Let's look at the Elasticsearch indices. You should see an index for Logstash like the one below.
curl http://localhost:9200/_cat/indices?v

Figure logstash index
Over time, Logstash will create more indices in Elasticsearch. You'll be able to search across those indices without a problem with Kibana, which you will be installing in a minute.
Creating a Cluster - For Informational Purposes Only - (OPTIONAL)
You see that the health of the index is yellow, it's because there is only one copy of the data for that index, and it's stored on this host. For this project, we are going to operate with one copy of our data.
At the end of this project, we will show you how to add and configure another node If you want to eliminate single points of failure for your Elasticsearch cluster in a production environment,
Elasticsearch can consume a lot of memory. If you are experiences issues, increase the amount of memory allocated to the virtual machine to at least 3 GB if possible. You can do this with a config.vm.provider block of configuration. Update your Vagrantfile to look like the following:
                                                      Vagrant.configure("2") do |config|
                                                      config.vm.box = "jasonc/centos8"
                                                      config.vm.hostname = "elkstack"
                                                      config.vm.network "private_network", ip: "10.23.45."90
                                                      config.vm.provider "virtualbox" do |vb|
                                                      vb.memory = "3072"
                                                      end
                                                      end
Kibana uses the same GPG key as Elasticsearch, so you don’t need to re-import the key. Additionally, the Kibana package is in the same ELK stack repository as Elasticsearch. Hence, there is no need to create another repository configuration file.
To install Kibanra, open a terminal window, enter the following:
sudo dnf install -y kibana By default, Kibana only listens on localhost. This means that you would not be able to connect to Kibana from outside the host. Let's change that so we can access Kibana using the VM's IP address. Open up the Kibana configuration file for editing.
sudo nano /etc/kibana/kibana.yml Add this line of configuration.
server.host: "10.23.45.90"Now that we've configured Kibana, it's time to start it. We'll also enable it so that it starts on boot as well.
                                                        sudo systemctl start kibana
                                                        sudo systemctl enable kibana
Once Kibana has been started, open a web browser on your local machine and visit this address: http://10.23.45.90:5601. Kibana operates on port 5601, so that's the port you'll connect to. It can take Kibana a few minutes to start, so please be patient.
You'll be presented with a welcome screen. Click on the "Explore on my own" link
<>
In the upper-left corner click on the menu icon.
Scroll down. Under the "Management" section, click the "Stack Management" link.

Scroll down. Under the "Kibana" section, click the "Index Patterns" link.

Now click on the "Create index pattern" button.

In the "Index pattern name" field, enter "logstash*" . This tells Kibana to use any indices in Elasticsearch that start with "logstash".
In the "Time Field" dropdown menu, select "@timestamp". Your screen should look like the one below. Then click the "Create index pattern" button.
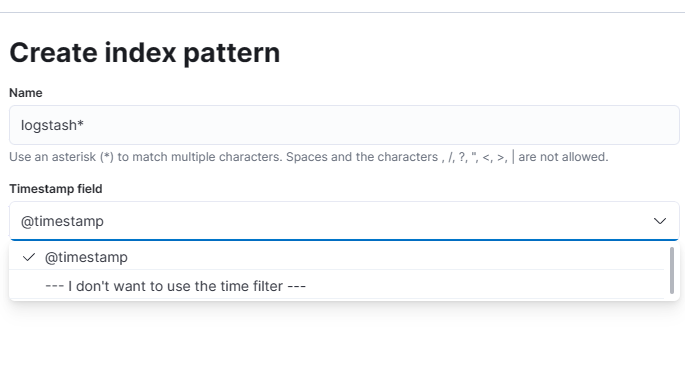
You'll be brought to a screen that shows information about the index pattern that you just created.
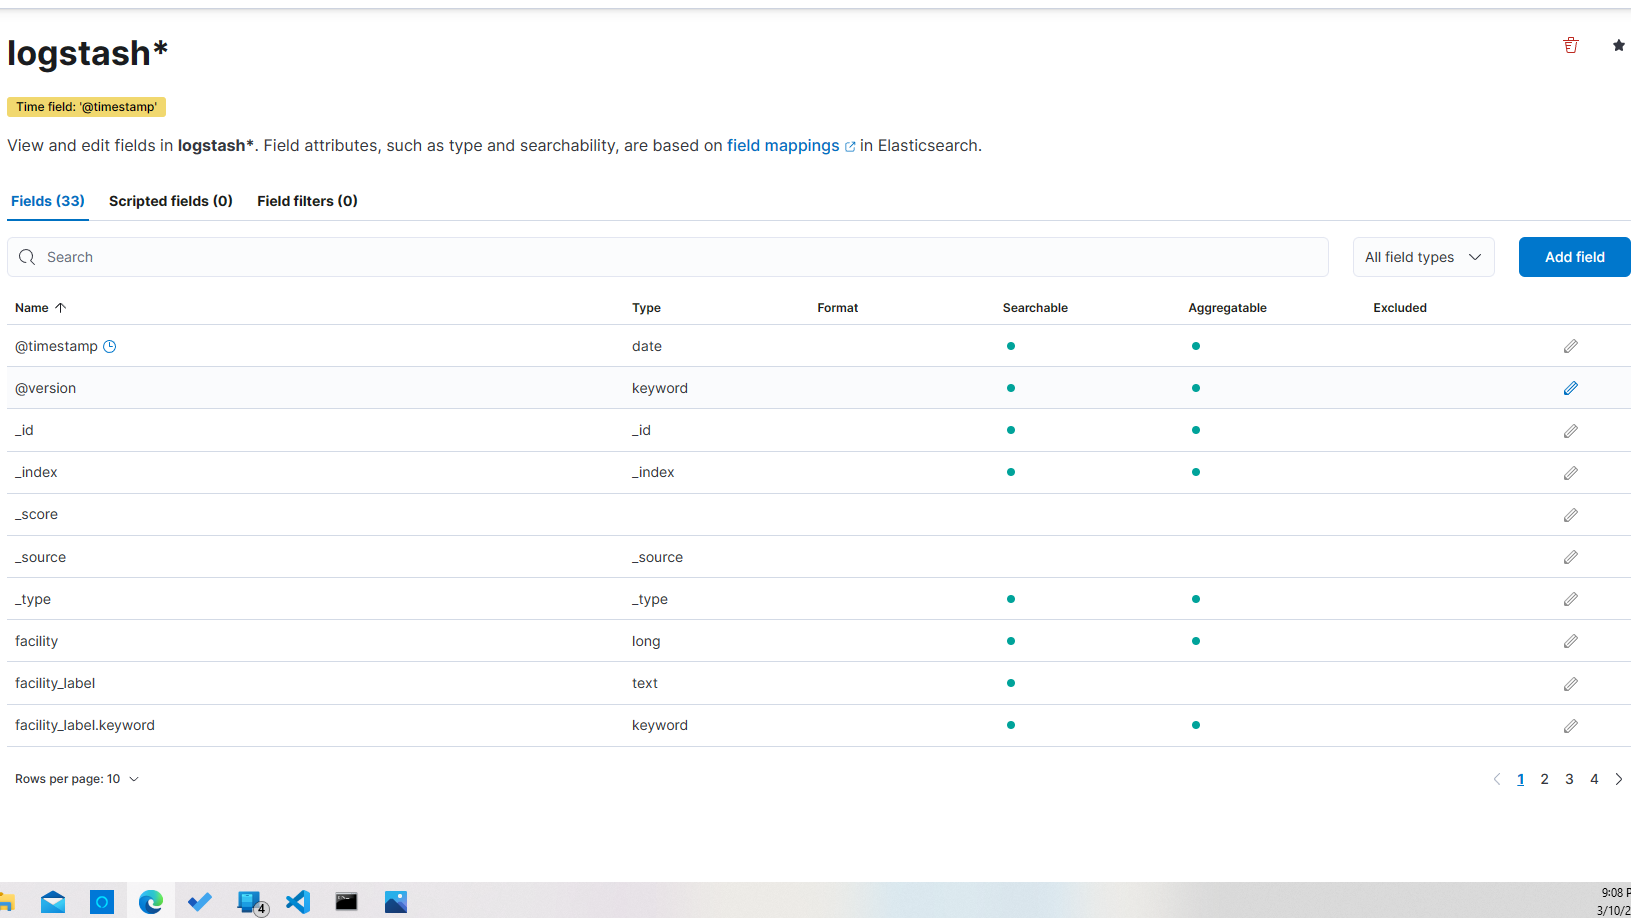
Now you can start searching for log messages by clicking on the "Discover" link under "Analytics" in the right-hand menu.

Return to your command line session. Let's use the logger command to send a message to syslog. Of course, this message will be sent to Logstash as well, and will ultimately be stored in Elasticsearch. Here is the command:
logger "testing sudo search" This will send a syslog message of "testing sudo search". You can see it in /var/log/messages.
sudo grep testing /var/log/messagesNow, return to Kibana (http://10.23.45.90:5601/app/discover#/) perform a search for "sudo". This returns all results that have the text "sudo" anywhere in its associated record. Here's an example that shows the word "sudo" in the "message" field of the record -- the one we created with the logger command.

You'll notice the various parts of the record. There is the message, the timestamp, the type, host, program, etc. You can use each one of these fields to narrow your search results. For example, let's search for sudo, but let's only display results that come from the sudo program. To do that, type in the search string "program:sudo". then click on "update" at the far top right
Now we'll only get syslog messages generated by the sudo command. You will not find the message generated by the logger command used earlier, even though the word "sudo" was in the message. (For that, you could use this search: "message:sudo")
If you want to display all matches, simply enter in "*" in the search bar and hit enter.
You can explore the data that is available in the fields by clicking on them on the left side of your screen. For example, if you click on "program" you'll see data that matches that field.
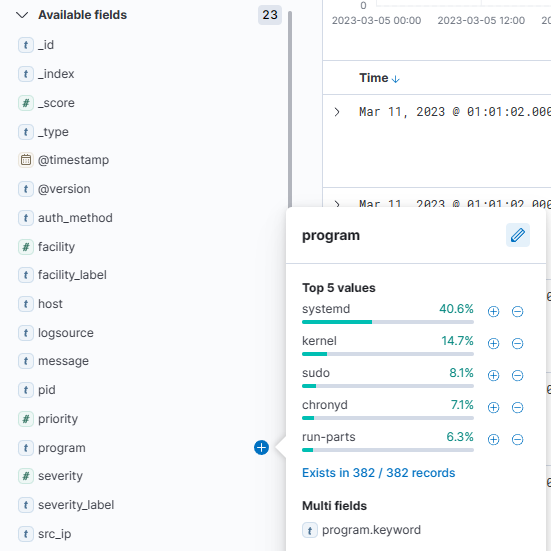
Let's do another search. This time, let's look for syslog messages generated by the sudo command that also contain the keyword "kibana." To do that, we'll use "AND" in our search. If you don't include "AND", Kibana will return results that match either of the conditions.
Here is the search: "program:sudo AND kibana". This is an example match that shows where the vagrant user ran "systemctl enable kibana".

Now let's create a graph. First, let's get some data to graph. Return to the command line and log out of the system and back in again a few time. This will create log entries for each of your connections.
                                                      exit
                                                      vagrant ssh
                                                      exit
                                                      vagrant ssh
                                                      exit
                                                      vagrant ssh
still working on the project
Still working on the project
still working on the project