
 By Oliver Awa. Updated Oct 12, 2024. 1st
Published on Oct
12, 2022
Learn more about
Oliver
By Oliver Awa. Updated Oct 12, 2024. 1st
Published on Oct
12, 2022
Learn more about
Oliver
Project 1 -part 1 is all about creating a local
test environment.
Think of this environment as your own personal sandbox where you
can play and experiment without worrying about breaking something. You
will be setting up a
local
environment on your
local machine
where you will be able to quickly and easily create new Linux systems
giving you a safe place to
learn and
buy quickly.
I'm talking about having a new Linux system running in about 30 seconds
to 2 minutes. To get
this done, we
will be
implementing what is call
virtualization
Note: It's important that you complete this first
project successfully as it
will be the
basis of the
rest of the course in
future projects. In subsequent projects, you'll be creating more Linux
systems using your local
test
environment.
You're going to end up with an entire network of Linux systems which can
be very similar to what
you'll
find at an
actual company.
Virtualization is a technology that you can use to create virtual representations of servers, storage, networks, and other physical machines. Virtual software mimics the functions of physical hardware to run multiple virtual machines simultaneously on a single physical machine.
Virtualization is a process that allows a computer to share its hardware
resources with multiple digitally separated
environments. Each virtualized environment runs within its allocated
resources, such as memory, processing power,
and
storage.
With virtualization, organizations can switch between different operating
systems on the same server without
rebooting.
Some examples of virtualization software are; VMware, Virtualbox .........
Virtual machines and hypervisors are two important concepts in virtualization.
Virtual machine
A virtual machine is a software-defined computer that runs on a physical
computer with a separate operating system
and
computing
resources. The physical computer is called the host machine and virtual
machines are guest machines. Multiple
virtual
machines
can run on a single physical machine. Virtual machines are abstracted from
the computer hardware by a hypervisor.
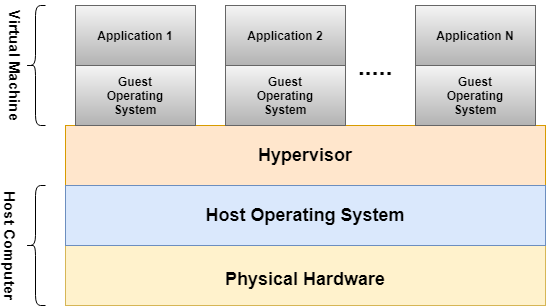
Figure 1:Structure of Virtual machine
Hypervisor
The hypervisor is a software component that manages multiple virtual
machines in a computer. It ensures that each
virtual
machine gets the allocated resources and does not interfere with the
operation of other virtual machines. There are
two
types of hypervisors.
Type 1 hypervisor
A type 1 hypervisor, or bare-metal hypervisor, is a hypervisor program
installed directly on the computer’s hardware
instead
of the operating system. Therefore, type 1 hypervisors have better
performance and are commonly used by enterprise
applications. KVM uses the type 1 hypervisor to host multiple virtual
machines on the Linux operating system.
Type 2 hypervisor
Also known as a hosted hypervisor, the type 2 hypervisor is installed on an
operating system. Type 2 hypervisors are
suitable for end-user computing.
Among the numerious virtualization software out there, we have choosen to
work with VirtualBox. you can learn more
about this
software by clicking the following link
http://virtualbox.org
Oracle VM VirtualBox
We could have as well create and account with any cloud provider and lunche
an instance in the cloud but at the end
of
it, we will have to
encure some cost. You can go ahead with that if you choose to.
VirtualBox is a program that allows you to install and run various operating systems (OS) inside your existing operating system using the concept of virtual machines. As the name suggests, a VM is a virtual computer that can run programs and operating systems. Think of it as a computer within a computer. Here are some the features and benefit of virtualbox
Click on the link, learn, install virtualbox and a linux OS on it.
Install linux on Oracle
VirtualBox
If you go through the manuall process of installing linux on virtualbox, you
will realized that it time consumming.
if you have 10 linux OS to install on virtualbox, the process will have to
take a couple of minutes or hours. SO
let's Automate it by bringing in a command online tool call
VAGRANT
Vagrant is an open-source tool that helps us to automate the creation and
management of Virtual Machines. In a
nutshell,
we can specify the configuration of a virtual machine in a simple
configuration file, and Vagrant creates the same
Virtual
machine using just one simple command. It provides command-line interfaces
to automate such tasks.
You can read more about vigrant here
VAGRANT
The basic unit of Vagrant setup is Vagrant Box. Just like Docker Image, Vagrant Box is a self-contained image of the Operating System. More specifically, it is a packaged Virtual Machine. Instead of building a virtual machine from scratch, which would be a slow and tedious process, Vagrant uses a base image to quickly clone a virtual machine. These base images are known as "boxes" in Vagrant, and specifying the box to use for your Vagrant environment is always the first step after creating a new Vagrantfile.,
When you initiate a Vagrant project with the command: vagrant init username/box name, a box is added and a vagrantfile is automatically created or installed.
When you want to install a box without creating a new Vagrantfile, you will have use the box add subcommand.
You can add a box to Vagrant with vagrant box add. This stores the box under
a specific name so that multiple
Vagrant environments can re-use it. When you run the add box command,
vagrant box add hashicorp/bionic64Vagrant will prompt you to select a provider. Type 2 and press Enter to select Virtualbox. Note; if type virtualbox, you will recieve an error. picture seen below
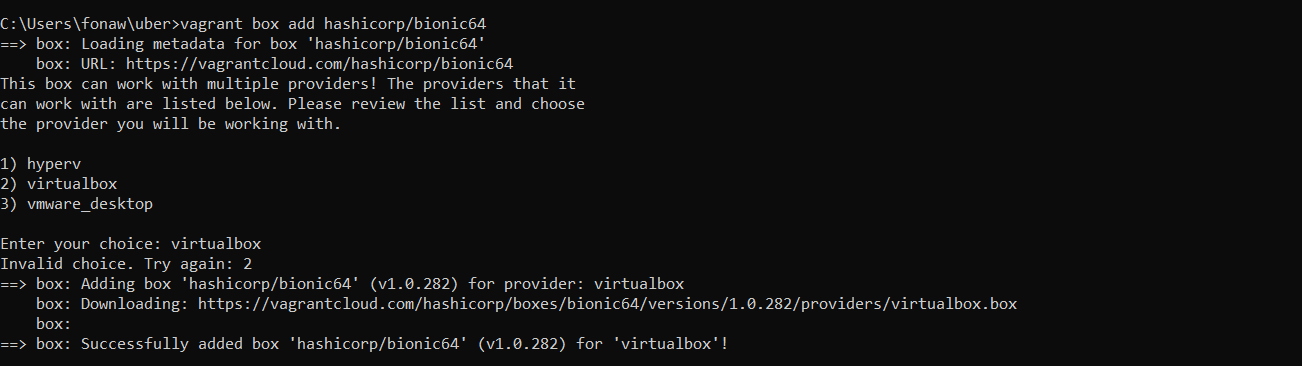
Figure 3 vagrant box
The command download the box named hashicorp/bionic64 from HashiCorp's Vagrant Cloud box catalog, where you can find and host boxes.
Boxes are globally stored for the current user. Each project uses a box as an initial image to clone from, and never modifies the actual base image. This means that if you have two projects both using the hashicorp/bionic64 box you just added, adding files in one guest machine will have no effect on the other machine.
As earlier mention, you can add a box to Vagrant either by initializing or adding it explicitly. After successfully adding a box, you need to configure your project to use it as a base. Create your project folder or directory and in that directory, open a Vagrantfile and replace the contents with the following .
Vagrant.configure("2") do |config|
config.vm.box = "hashicorp/bionic64"
config.vm.box_version = "1.0.282"
Note:The hashicorp/bionic64 in this case must match the name you used to add the box above.
The primary function of the Vagrantfile is to describe the type of machine
required for a project, and how to
configure
and provision these machines. Vagrantfiles are called Vagrantfiles because
the actual literal filename for the
file is Vagrantfile.
Vagrant is meant to run with one Vagrantfile per
project, and the Vagrantfile is supposed
to
be
committed to version control. This allows other developers involved in the
project to check out the code, run
vagrant
up,
and be on their way. Vagrantfiles are portable across every platform Vagrant
supports.
The first step to configure any Vagrant project is to create a Vagrantfile
Now initialize the Vagrant project by runing vagrant init follow by the name of the box you have selected from the public catalog on Vagrant Cloud.
For example:
vagrant init generic/centos8.
when you run this command, a Vagrantfile will be created in the current directory or folder and you will see and output like the one below.
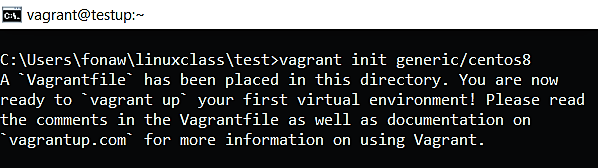
Figure 2 vagrant initialization
when you open the Vagrantfile with any text editor of your choose, you will see important configuration like
Vagrant.configure("2") do |config|
config.vm.box = "generic/centos8" (This is the Vagrant Box, that was mentioned during initialization.)
You can edit the Vagrantfile and set the hostname of the virtual machine to "testup ". Also, assign the IP address of 10.23.45.80 to the machine. You can as well future config the file to meet up your app demand.
Your vagrantfile will now look like this; (Note:This is just part of the file)
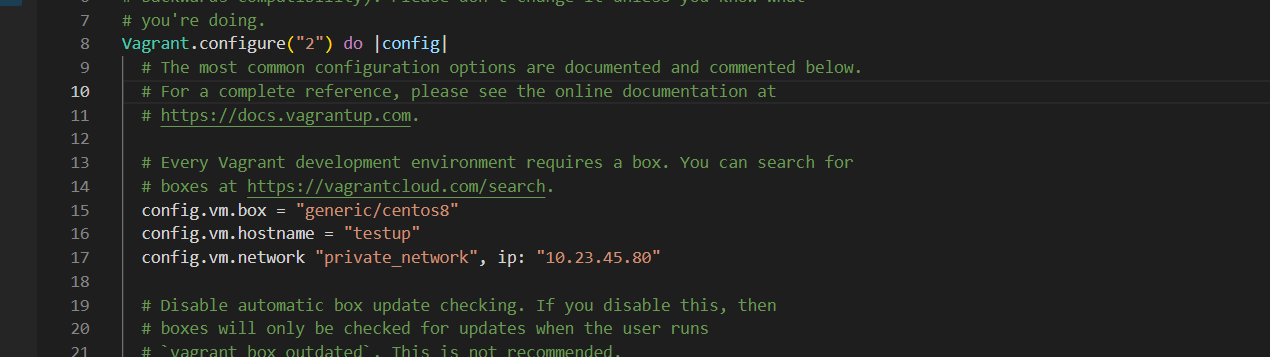
Figure 3 vagrant configuration
Now, the VM has been created. So, to get into it, run command vagrant ssh. After executing this command you are now inside the newly created VM. Now, anything can be done inside the VM through this terminal.
Note:Requires ssh client.
If you are a window user, you need to download
Git from git-scm.com in order
to be able to ssh into your machine. More on this in our next project.
To exit the machine run the command exit
Some important vagrant command and their functions are:
Next
- vagrant halt Stops the VM
- vagrant up Starts the VM
- vagrant suspend Suspends the VM
- vagrant resume Resumes the VM
- vagrant destroy Removes the VM (Note: The vagrant destroy command does not remove the downloaded box file.)
- vagrant box remove username/box-name Remove the box
- vagrant Shows your options
The goal of this project is to walk you through the process of setting up a local lab environment on Windows and other OS . After the installation process, we will be creating Linux virtual machines that will be running on your Windows or Mac system and we will be connecting to those Linux virtual machines using SSH. SSH stands for secure shell
Do Not Use or Enable Hyper-V or Virtual Machine Platform for this project:
. In this project we will be using vagrant to manage virtual machines running under VirtualBox. Because VirtualBox is incompatible with Hyper-V and Virtual Machine Platform, you will need to make sure Hyper-V and Virtual Machine Platform are disabled. This should only be an issue if you are running a Windows Server installationAntivirus Software Compatibility;Some Windows Antivirus software, such as Avira, has been known to interfere with the operation of VirtualBox. If you get an error when starting a Virtual Machine, try disabling your antivirus software.
Enable Virtualization Support for Your Processor:Make sure you have VT-x (for Intel processors) or AMD-v (for AMD processors) enabled in your physical computer’s BIOS. This varies from manufacturer to manufacturer, so you might have to look up the documentation for your specific computer. Many computers have these options enabled by default, but some do not. If virtualization support is not enabled you may encounter an error inside your virtual machines like this: "This kernel requires an x86-64 CPU, but only detected an i686 CPU"
Upgrade Powershell;If the vagrant up command hangs without producing any output, and you are running Windows 7, upgrade your version of PowerShell to at least version 4.0.
SSH stands for secure shell. SSH is the network protocol used to connect to Linux systems. By default Windows doesn't come with an SSH client installed.Mac does.
One way to install an SSH client on Windows is to install git spelled git. Git is used for Version Control but we're interested in the SSH client that comes with it. To install it open up a web browser and download the git installer by clicking on this link. https://git-scm.com/download/win
Once downloaded, click on the file to start the installation. For the most part, we're going to be accepting the defaults setting. However there is one place where we're going to select something different from the default. So keep on accpting the default configuration or setting .
At the point way it says Ajusting your PATH environment, select the option Use Git and optional Unix tools from the command prompt. As seen on figure 1 below
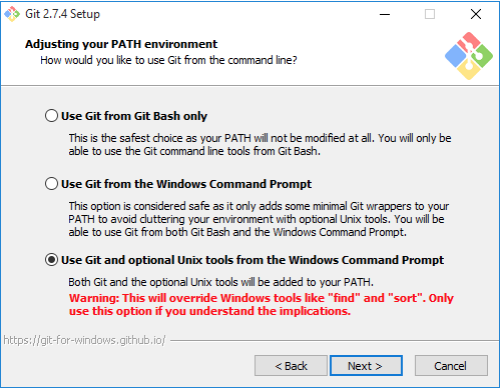
Figure 1 git installation
This will allow us to access the SSH command or the SSH client that comes with Git so go ahead and select that option and click on next the default is fine here go ahead click on next, then next.... click on install to perform the installation and finally click on finish to complete the installation.
To prove that the SSH client did get installed, open up a command prompt, type in SSH and hit enter you will see some output from the SSH command which means it was successfully installed on Windows.
Vagrant requires the "Microsoft Visual C++ 2010 SP1 Redistributable Package (x86)" to be installed if you are running Windows.
Click on the this link https://www.microsoft.com/en-us/download/details.aspx?id=26999
Go ahead and click on the installer to start the installation. click the check mark to agree to the terms and conditions and click install. if you're asked any yes or no question simply click on yes. Click on close to complete the installation.
Visit VirtualBox.org in your web browser. select the virtualbox file for your platform. Download and in install it. In the installation process simply accept all the defaults option.If you're asked for an administrator user and password, be sure to enter it. Finally click on finish. Reboot your system if requested by the installer. You can start virtualbox to confirm a successful installation process.
Download Vagrant from this link: https://www.vagrantup.com/downloads.html
If you are using Windows, download the file from the "windows" subdirectory. If you are using a Mac, download the file from the "mac" subdirectory.
Install the software on your local machine, accepting all the defaults. If you're asked for an administrator user and password, be sure to enter it. Reboot your system if requested by the installer.
Congratulation, you have successfully create an environment to run linux OS
PreviousWe will Create a folder where we want to save all the Vagrant-related files. Since we will be working on different project, we will create a sub-folder or sub directory to host the individual project files.
The first step to configure any Vagrant project is to create a Vagrantfile. The Vagrantfile allows you to:
Vagrant has a built-in command for initializing a project, vagrant init which can take a box name and URL as arguments.
Click on this link : https://vagrantcloud.com/boxes/search and choose a box. In this project we will choose : generic/centos8
While in the sub-directory or folder we created for this projec; run the command:
vagrant init generic/centos8
When the command successfully executed, you will see an out like the one below;
Figure 1 vagrant initialization
The command output clearly tell you that a vagrantfile has been placed in the current directory or folder.
When you open the Vagrantfile, you will see some pre-populated comments simillar to the one below; (Note: The one we have below is just part of the file)
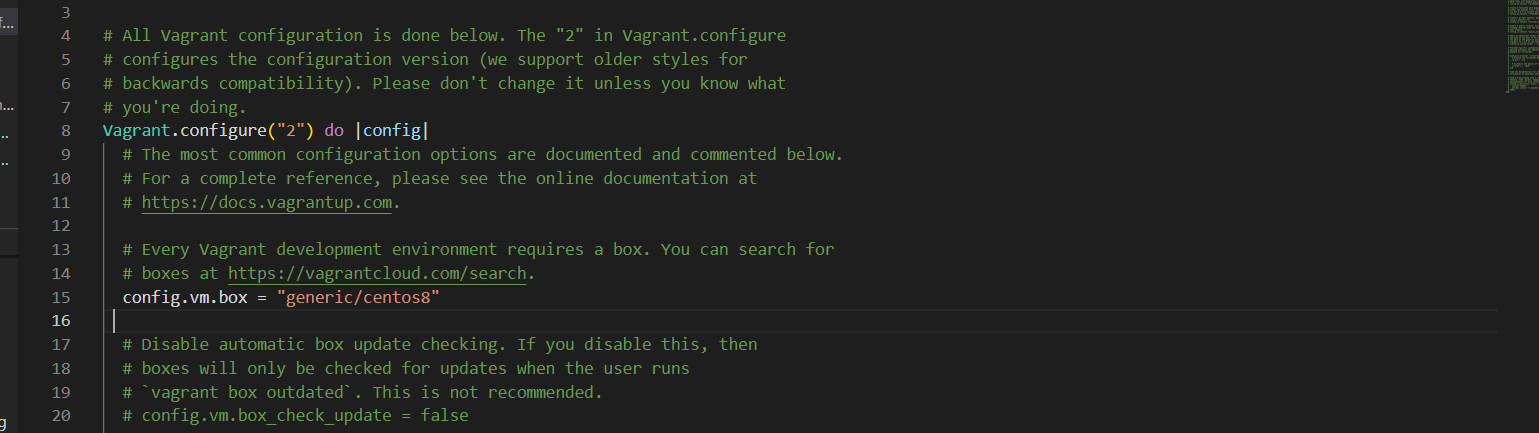
Figure 2 vagrant_init configuration
At this point, we will go ahead and modified the file by adding a hostname and an IP address to the server as seen below.
Figure 3 vagrant configuration
The first time you run the "vagrant up" command Vagrant will import (clone) the vagrant box into VirtualBox and start it. If Vagrant detects that the virtual machine already exists in VirtualBox it will simply start it. By default, when the virtual machine is started, it is started in headless mode meaning there is no UI for the machine visible on your local host machine.
Let’s bring up your first virtual machine running Linux with Vagrant.
vagrant up
Start the VirtualBox application and confirm that the virtual machine running.
You can also use the "vagrant status" command to check the status of the virtual machine. Confirm that it shows the virtual machine is in a running state.
vagrant status
SSH, secure shell, is the network protocol used to connect to Linux systems. Vagrant provides a nice shortcut to ssh into the virtual machine.
vagrant ssh
After running "vagrant up" and "vagrant ssh" you should be presented with a prompt that looks similar to this:
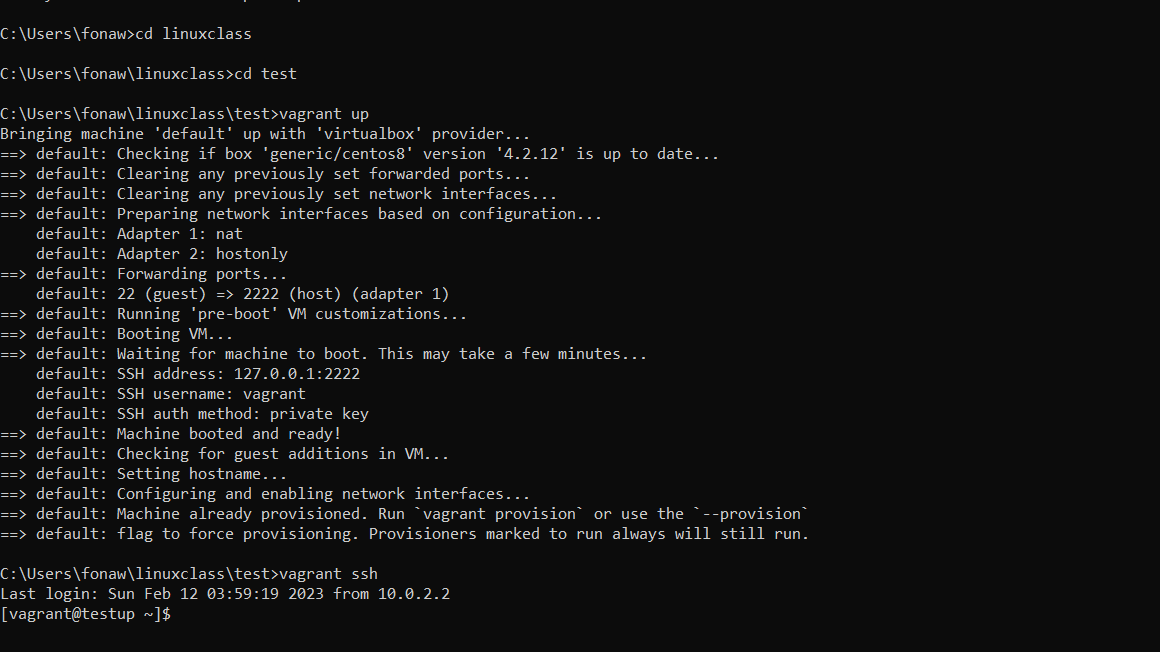
Figure 4 Boot up Virtual Machine
Now you are connected to the Linux virtual machine as the vagrant user. This default vagrant account is used to connect to the Linux system. For your convenience, the Vagrant application takes care of the details that allow you to connect to the box over SSH without a password. For reference, the password for the vagrant account is "vagrant". The password for the root account is also "vagrant". The vagrant user has full sudo (administrative) privileges that allow you to further configure the system.
Congratulation, your centos8 is up and runing
To log out of the Linux system, run the command exit or logout
We will install a web server by name nginx in the vm and we will create a simple html page that will be display in the browser. Note: Nginx is a well-known web server alternative to Apache.
ssh into your system with the command vagrant ssh and run the following command
Note: Before any installation, always update the local repository to ensure you are downloading the latest software. Use the command:
sudo dnf update
You can inspect the Nginx package before adding it to your system. Request to see the RPM metadata included in every RPM package:
sudo dnf info nginx
Next, install Nginx on CentOS 8 with the command:
sudo dnf install nginx
The output shows you a list of Nginx packages that have been installed, take a look at
Although you have installed Nginx, the service will not start automatically. Start the service by runing the command:
sudo systemctl start nginx
To enable the service to start running upon boot time use:
sudo systemctl enable nginx
If you check the service status, the output should show you Nginx is active (running):
sudo systemctl status nginx
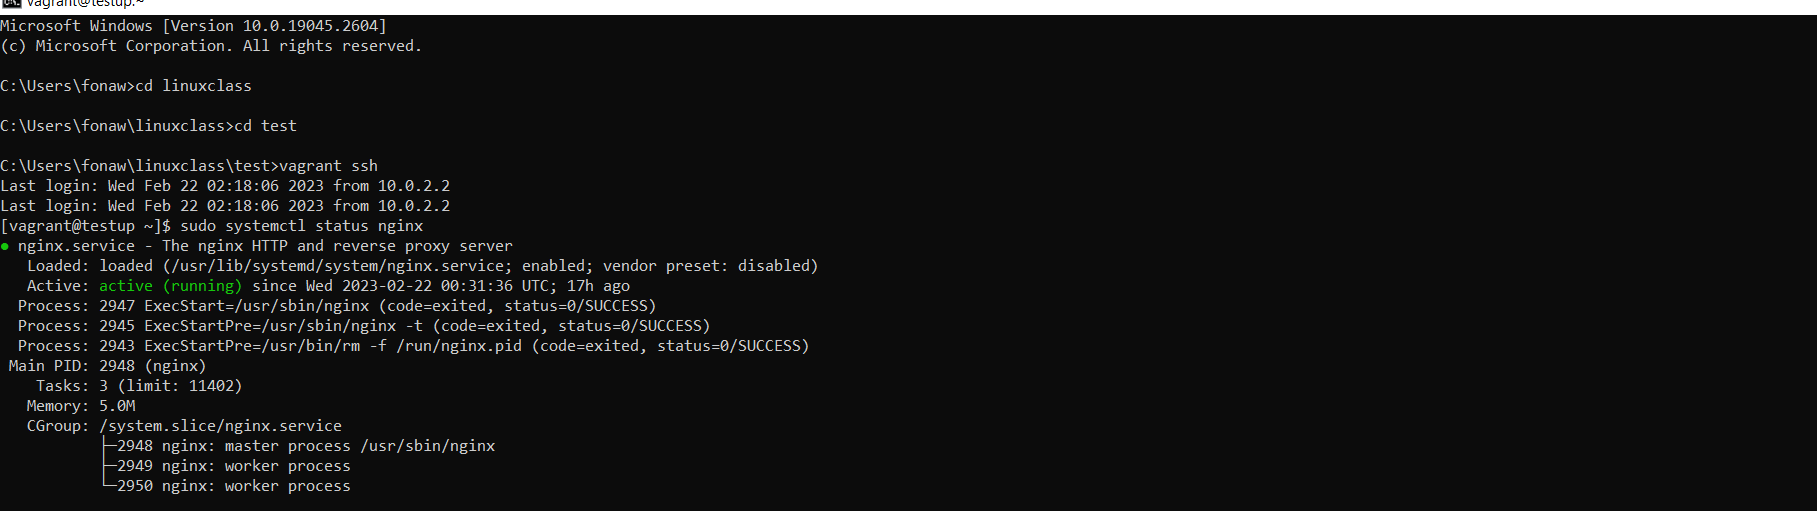
Figure 5 Nginx installation
Stop Nginx using the command:
sudo systemctl stop nginx
Restart Nginx (stop and start the service again) with the command:
sudo systemctl restart nginx
Reload the configuration files without stopping the service:
sudo systemctl reload nginx
Nginx includes firewalld service files that specify the service uses ports 80 (HTTP) and 443 (HTTPS) for web traffic. Therefore, you need to open and enable these ports to allow permanent access.
Open port HTTP and HTTPS with the commands:
sudo firewall-cmd --permanent --zone=public --add-service=http --add-service=https
sudo firewall-cmd --reload
sudo firewall-cmd --list-services --zone=public
Now, we need to double-check if Nginx is working by visiting your public IP address (or domain name).
In early part of this project we assign an ip of 10.23.45.80 to this server in vagrantfile
if you can't remember what the ip of a server is, run the command :
ip addr
An output like the one below will be displayed and you see the ip and it subnet mask
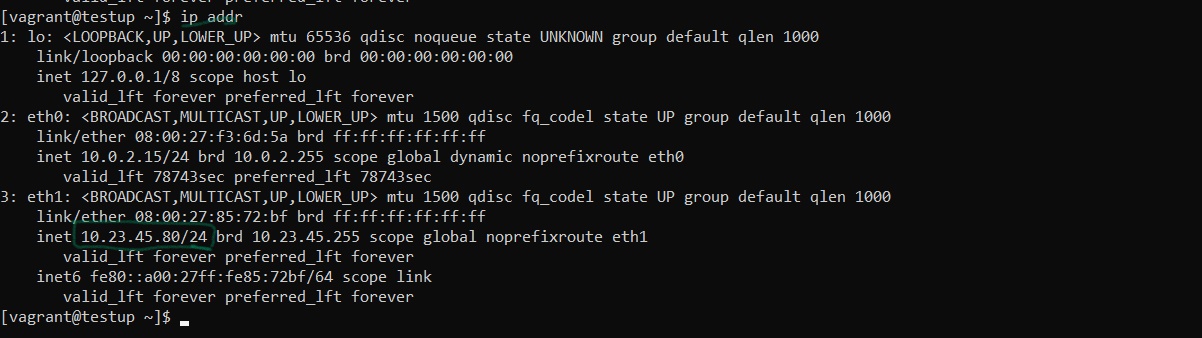
Figure 6 server ip address
Then, open a web browser and paste the IP address (or domain name) in the URL bar. This should open the Nginx Welcome Page, confirming you have successfully installed and set up the server.
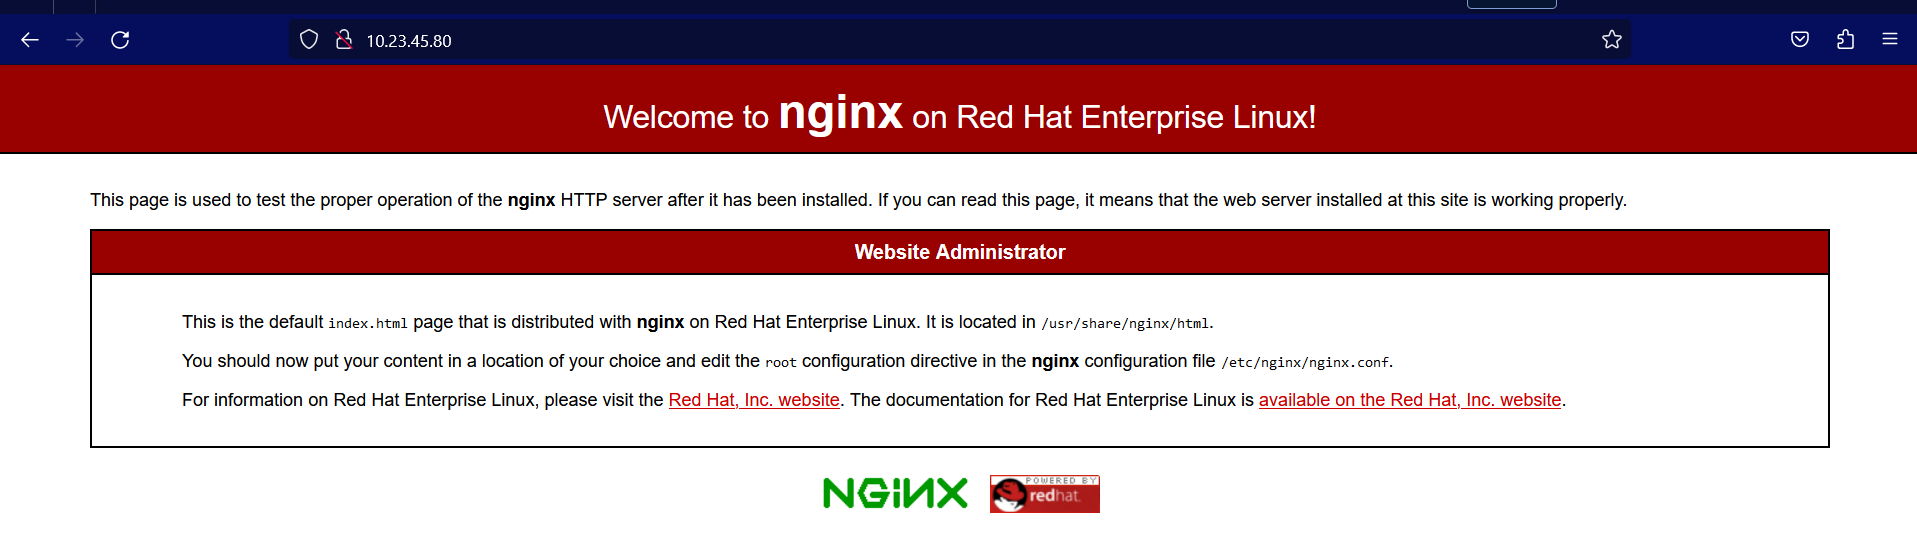
Figure 7 Nginx welcome page
We have successfully installed nginx and we will be creating an html page that will be display in the browser. but befor we do that, take note of the location of nginx important configuration file
The Nginx welcome page we display above is stored in the Nginx root directory (/usr/share/nginx/html).
cd into this directory by runing the command:
cd /usr/share/nginx/html
Run the command below to see the content of the file
sudo vim index.html
While still in the nginx root directory, we will create a small html page like the one below and we will name it index1.html

Figure 8 simple html page
The command below will open up a new file in vim, copy the html code above past it in the file, save and exit
sudo vim index1.html
Reload and the start nginx
Now you are ready to display your html page in the browser. open any browser of your choice and type 10.23.45.80/index1.html A page like the one below will display
Next

Figure 9 simple html page output
Vagrant allows you to automatically provision environments, including web servers. In this project, we will use the vagrant box: "hashicorp/bionic64" we added in project 1. part 1, to boot up a machine all together with the Apache web-server. we will then create a simple html page that will be display in the browser.
The vagrant box: "hashicorp/bionic64" that we will use to boot up this machine has already been created or installed.
We will boot up this server together with the Apache web-server that will serve the simple html page that we will create
On the local machine, we will create a directory or folder that will host all the project files. In this directory, we will create a script that will download and install Apache. Again, in this same directory, we will create a vagrantfile with the configuration of the box we want to boot up. Finally we will create a subdirectory from where apache will serve our html content which will be placed in the subdirectory.
Open the command prompt or terminal and create a project directory with the command below.
mkdir lab
As mention earlier that Vagrant allows us to automatically installed software bundle together with the box or configured in the vagrant_file to provision when we run vagrant up
On your local machine, open a text editor, copy, paste and save the script below as bootstrap.sh in the same directory as your Vagrantfile. (The project directory we created earlier)
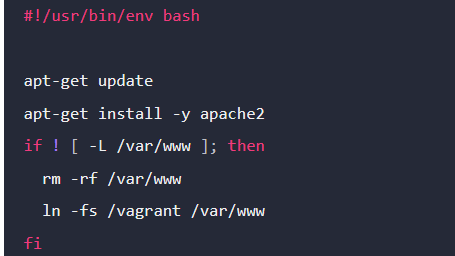
Figure 1 Bash script
This script downloads, installed Apache, start and creates a symlink between your synced files directory and the location where Apache will look for content to serve.
On the command prompt or terminal, Move into the project directory we created a earlier, if you are not there
cd lab
Run the command below to create a Vagrant configuration file (Vagrantfile)
vagrant init hashicorp/bionic64
This command create a vagrant file in your project directory. Go ahead, open the file in any text editor and edit the Vagrantfile to use the script when you provision the environment. Your vagrantfile should look like the one below
Notee: If you created the bash script file as a txt file and stored in the project directory, make sure the file name in the vagrant configuration file includ the ".txt" extension as in my case. otherwise let the name remain as "bootstrap.sh"
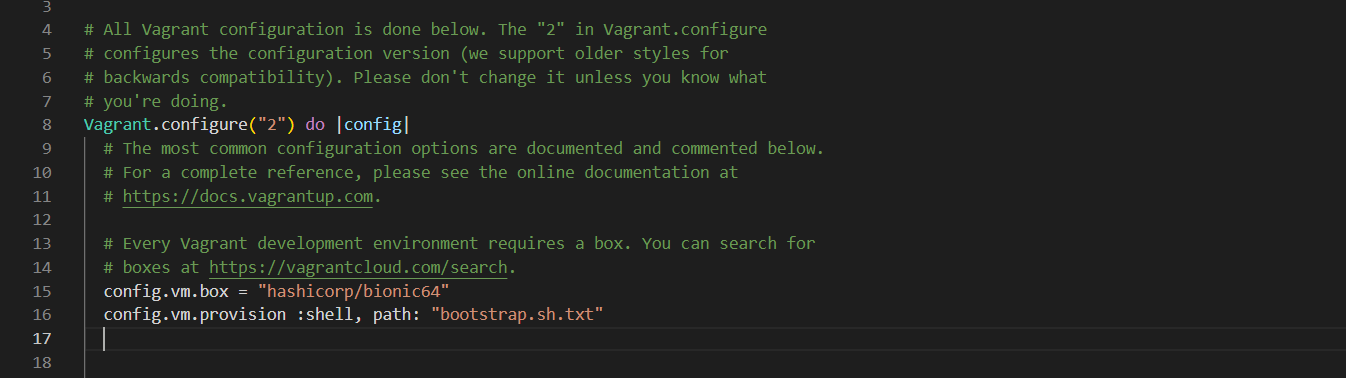
Figure 1 Bash script
The provision line configures Vagrant to use the shell provisioner to set up the machine with the bootstrap.sh.txt file. The file path is relative to the location of the project root which should be the location of the Vagrantfile.
On your local machine and in the project directory, create a subdirectory from where Apache will serve your content.
mkdir html
In the subdirectory, create a simple html page with the code below and save it as "index.html"
Figure 2 html page
Note: You can as well boot up the server, ssh into it, then change directory into the apache2 documentroot directory which is "/var/www/html". while in this directory, create a new file with the command "sudo nano index.html", paste the html code save and exit. An html page will still be created in the subdirectory we you created above
Use vagrant up to create your machine and have Vagrant automatically provision it.
vagrant up
After Vagrant completes provisioning, the web server will be active. Double check the status by runing the commamd:
sudo systemctl status apache2
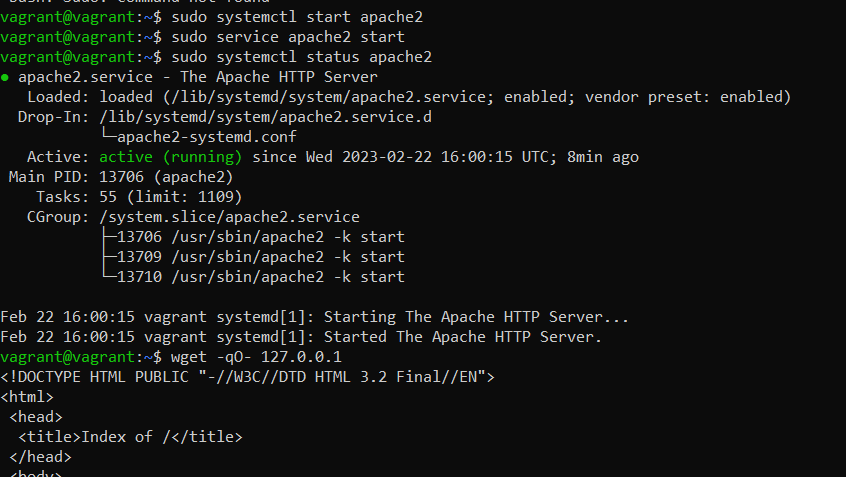
Figure 2 html page
You cannot see the website from your own browser yet, but you can verify that the provisioning works by loading a file from within the machine.
SSH into the guest machine.
vagrant ssh
Now get the HTML file that was created during provisioning by running the command.
wget -qo- 127.0.0.1
Figure 2 html page
Logout of your SSH session with the command
exit or logout
Port forwarding allows you to specify ports on the guest machine to share via a port on the host machine. This allows you to access a port on your own machine, but actually have all the network traffic forwarded to a specific port on the guest machine.
To set up a forwarded port so you can access Apache on your guest, add the config.vm.network parameter to your Vagrantfile. Below is the full file with port forwarding.
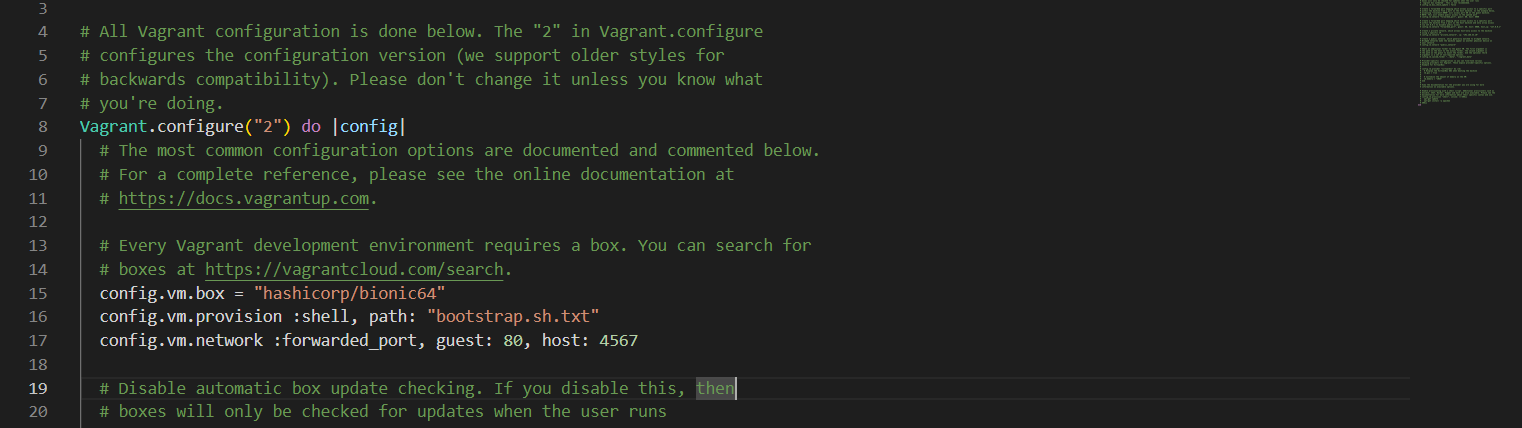
Figure 3 port forwarding in vagrant
Reload so that these changes can take effect.
vagrant reload
Once the machine has loaded, you can access http://127.0.0.1:4567 in your browser. You will find a web page that is being served from the guest virtual machine.
Previous
Performance monitoring and alerting are very crucial to measure the performance metrics of an application running in a production environment. In this project, you will create a metrics collection and graphing system. This will allow you to visually see what the system utilization is for a given host or across an entire environment. You will be installing two popular open-source tools known as Prometheus and Grafana alongside a Node_exporter. You will then use it to monitor servers running in our environment
Prometheus is an open-source service monitoring system and time series database, developed by SoundCloud. It collects metrics from configured targets at given intervals, evaluates rule expressions, displays the results, and can trigger alerts if some condition is observed to be true. Prometheus scraps the data with the timestamp which can be stored on a server and accessed using the PromQL.
Prometheus has super support API which makes Prometheus integration with different systems (for example, Docker, StatsD, MySQL, Consul, etc.) and any resource present in the Datacenter
Prometheus server is the core of Prometheus architecture which is divided into several parts like Storage, PromQL, HTTP server, etc. In Prometheus, server data is scraped from the target nodes and then stored into the database.
The Service Discovery help to identified services that are needed to be scraped.Through Service discovery we monitor the entities and can also locate its targets. Large-scale deployments can change all the time, and service discovery allows Prometheus to keep track of all the current endpoints effortlessly.
Once the services are identified and the targets are ready then we can pull metrics from it and can scrape the target. We can export the data of end point using node exporters. Once the metrics or other data is pulled, Prometheus stores it in a local storage.
The Alertmanager handles alerts sent by client applications such as the Prometheus server. It takes care of deduplicating, grouping, and routing them to the correct receiver integration such as email, PagerDuty, or OpsGenie. It also takes care of silencing and inhibition of alerts.
builds a bridge between the user and the system..
Grafana is open source visualization and analytics software. It allows you to query, visualize, alert on, and explore your metrics no matter where they are stored. It provides charts, graphs, and alerts for the web when connected to supported data sources such as Prometheus, graphite etc.
Grafana does not store any data, but instead, it relies on other data sources to send the data so that dashboard can be prepared. Also, Grafana is used for sending notifications and mail alerts based on various thresholds. One of the cool features of the Grafana is Grafana Labs where you can go and download the dashboard prepared by other developers so that you do not have to re-invent the wheel.
While Prometheus uses instrumented jobs to scrape metrics from non-Prometheus target endpoints, an exporter acts as an emissary push-gateway between a third-party application and the Prometheus server, to expose data as native metrics.
A Prometheus exporter aggregates and imports data from a non-Prometheus to a Prometheus system. An exporter is considered essential in any cloud-native ecosystem that includes applications that don’t expose Prometheus-supported metrics by default. A Prometheus exporter acts as a proxy between such an applications and the Prometheus server.
The vagrant box: "jasonc/centos8" will be use to boot up this machine.
Open the command prompt or terminal and create a project directory with the command below.
mkdir prometheus
Move into the folder or directory we just created by runing the command: cd prometheus
vagrant init jasonc/centos8
open and modified the vagrantfile by adding a hostname and an IP address to the server as seen below
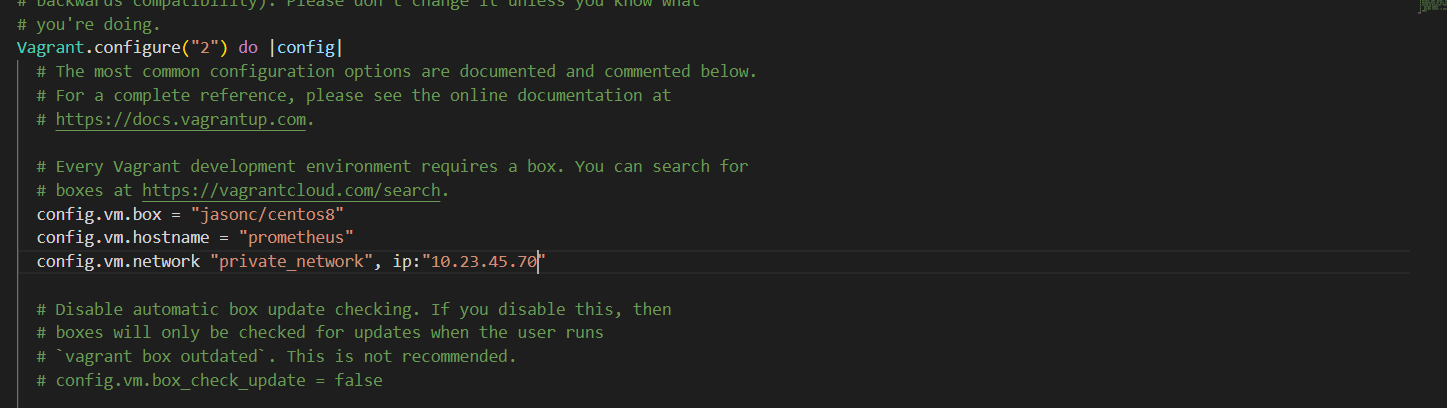
Figure 3 prometheus server configurationt
Boot up the virtual machine, check the status and ssh into the machine with the following command>
vagrant up
vagrant status
vagrant ssh
Prometheus has various ways of installation for example - pre-compiled binaries, from source, Docker. But to keep the installation simple we are going to use the pre-compiled binaries for installing Prometheus on the centos8 machine.
I do not want to start working in our root directory, so i will create a directory named as "Prometheus" with the command below.
mkdir prometheus
Then, move into the directory
cd prometheus
For security purposes, we’ll begin by creating two new user accounts, prometheus and node_exporter. We’ll use these accounts throughout the tutorial to isolate the ownership on Prometheus’ core files and directories.
Create these two users, and use the --no-create-home and --shell /bin/false so that these users can’t log into the server.
sudo useradd --no-create-home --shell /bin/false prometheus
sudo useradd --no-create-home --shell /bin/false node_exporter
Before we download the Prometheus binaries, create the necessary directories for storing Prometheus’ files and data. Following standard Linux conventions, we’ll create a directory in /etc for Prometheus’ configuration files and a directory in /var/lib its data.
sudo mkdir /etc/prometheus
sudo mkdir /var/lib/prometheus
Now, set the user and group ownership on the new directories to the prometheus user.
sudo chown prometheus:prometheus /etc/prometheus
sudo chown prometheus:prometheus /var/lib/prometheus
With our users and directories in place, we can now download Prometheus and then create the minimal configuration file to run Prometheus for the first time.
1. Goto Download Page of Prometheus and select the prometheus-x.xx.x.linux-amd64.tar.gz file for download. (Note- Here x.xx.x is version number)
Download the binary file by runing the command below. Make sure you replace the version with what you sellected
wget https://github.com/prometheus/prometheus/releases/download/v2.37.6/prometheus-2.37.6.linux-amd64.tar.gz
Extract the download binary file. (Note- Replace x.xx.x with the downloaded version of Prometheus)
tar xvfz prometheus-2.37.6.linux-amd64.tar.gz
This will create a directory called prometheus-2.0.0.linux-amd64 containing two binary files (prometheus and promtool), consoles and console_libraries directories containing the web interface files, a license, a notice, and several example files.
Verify it by runing the command ls -lart . When you run the command, you will see the prometheus extracted directory (prometheus-2.37.6.linux-amd64)
Navigate to prometheus extracted directory (cd prometheus-x.xx.x.linux-amd64)
cd prometheus-2.37.6.linux-amd64
Again, run the command ls -lart. to see the content we got from extracting the file
Move back to the previous directory (prometheus) with the cd command
Copy the two binaries to the /usr/local/bin directory.
sudo cp prometheus-2.37.6.linux-amd64/prometheus /usr/local/bin/
sudo cp prometheus-2.37.6.linux-amd64/promtool /usr/local/bin/
Set the user and group ownership on the binaries to the prometheus user created above
sudo chown prometheus:prometheus /usr/local/bin/prometheus
sudo chown prometheus:prometheus /usr/local/bin/promtool
Copy the consoles and console_libraries directories to /etc/prometheus.
sudo cp -r prometheus-2.37.6.linux-amd64/consoles /etc/prometheus
sudo cp -r prometheus-2.37.6.linux-amd64/console_libraries /etc/prometheus
Set the user and group ownership on the directories to the prometheus user. Using the -R flag will ensure that ownership is set on the files inside the directory as well.
sudo chown -R prometheus:prometheus /etc/prometheus/consoles
sudo chown -R prometheus:prometheus /etc/prometheus/console_libraries
Lastly, remove the leftover files from your home directory as they are no longer needed.
rm -rf prometheus-2.37.6.linux-amd64.tar.gz
rm -rf prometheus-2.37.6.linux-amd64
Now that Prometheus is installed, we’ll create its configuration and service files in preparation of its first run.
Prometheus collects metrics from targets by scraping metrics HTTP endpoints. Since Prometheus exposes data in the same manner about itself, it can also scrape and monitor its own health.
In the /etc/prometheus directory, use nano or your favorite text editor to create a configuration file named prometheus.yml. For now, this file will contain just enough information to run Prometheus for the first time. Save the following basic Prometheus configuration as a file named prometheus.yml:
sudo nano /etc/prometheus/prometheus.yml
Warning: Prometheus’ configuration file uses the YAML format, which strictly forbids tabs and requires two spaces for indentation. Prometheus will fail to start if the configuration file is incorrectly formatted.
global:
scrape_interval: 15s # By default, scrape targets every 15 seconds.
# Attach these labels to any time series or alerts when communicating with
# external systems (federation, remote storage, Alertmanager).
external_labels:
monitor: 'codelab-monitor'
# A scrape configuration containing exactly one endpoint to scrape:
# Here it's Prometheus itself.
scrape_configs:
# The job name is added as a label `job=` to any timeseries scraped from this config.
- job_name: 'prometheus'
# Override the global default and scrape targets from this job every 5 seconds.
scrape_interval: 5s
static_configs:
- targets: ['localhost:9090']
In the global settings, define the default interval for scraping metrics. Note that Prometheus will apply these settings to every exporter unless an individual exporter’s own settings override the globals.
This scrape_interval tells Prometheus to collect metrics from its exporters every 15 seconds, which is long enough for most exporters.
Prometheus uses the static_configs and targets directives to determine where exporters are running. Since this particular exporter is running on the same server as Prometheus itself, we can use localhost instead of an IP address along with the default port, 9090.
Now, set the user and group ownership on the configuration file to the prometheus user created in Step 1.
sudo chown prometheus:prometheus /etc/prometheus/prometheus.yml
With the configuration complete, we’re ready to test Prometheus by running it for the first time.
Start up Prometheus as the prometheus user, providing the path to both the configuration file and the data directory.
sudo -u prometheus /usr/local/bin/prometheus \
--config.file /etc/prometheus/prometheus.yml \
--storage.tsdb.path /var/lib/prometheus/ \
--web.console.templates=/etc/prometheus/consoles \
--web.console.libraries=/etc/prometheus/console_libraries
The output contains information about Prometheus’ loading progress, configuration file, and related services. It also confirms that Prometheus is listening on port 9090.
Now, halt Prometheus by pressing CTRL+C, and then open a new systemd service file.
sudo nano /etc/systemd/system/prometheus.service
The service file tells systemd to run Prometheus as the prometheus user, with the configuration file located in the /etc/prometheus/prometheus.yml and to store its data in the /var/lib/prometheus directory.
Copy the following content into the file:
[Unit]
Description=Prometheus
Wants=network-online.target
After=network-online.target
[Service]
User=prometheus
Group=prometheus
Type=simple
ExecStart=/usr/local/bin/prometheus \
--config.file /etc/prometheus/prometheus.yml \
--storage.tsdb.path /var/lib/prometheus/ \
--web.console.templates=/etc/prometheus/consoles \
--web.console.libraries=/etc/prometheus/console_libraries
[Install]
WantedBy=multi-user.target
Finally, save the file and close your text editor.
To use the newly created service, reload systemd.
sudo systemctl daemon-reload
You can now start Prometheus using the following command:
sudo systemctl start prometheus
Enable the service to start on boot.
sudo systemctl enable prometheus
To make sure Prometheus is running, check the service’s status.
sudo systemctl status prometheus
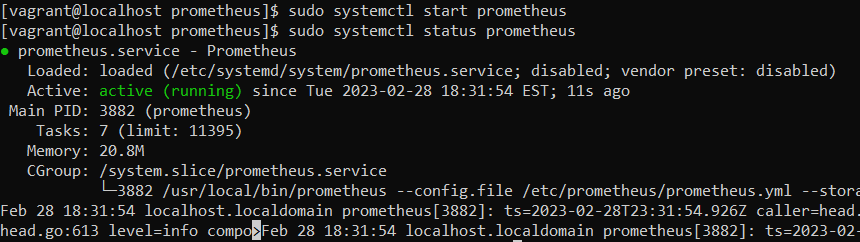
Figure 3 prometheus server configurationt
When you’re ready to move on, press Q to quit the status command.
Now as Prometheus installation and configuration is set up and it is ready to use we can access its services via web interface. On the webrowser of your choice, access prometheus graph UI by visiting the URL below. replaced the server-ip and hostname with their coresponding. In our case, we assign and ip addresss of "10.23.45.70 " to our centos8 server. prometheus start on port 9090. The screen below will be displayed
http://server-IP-or-Hostname:9090.
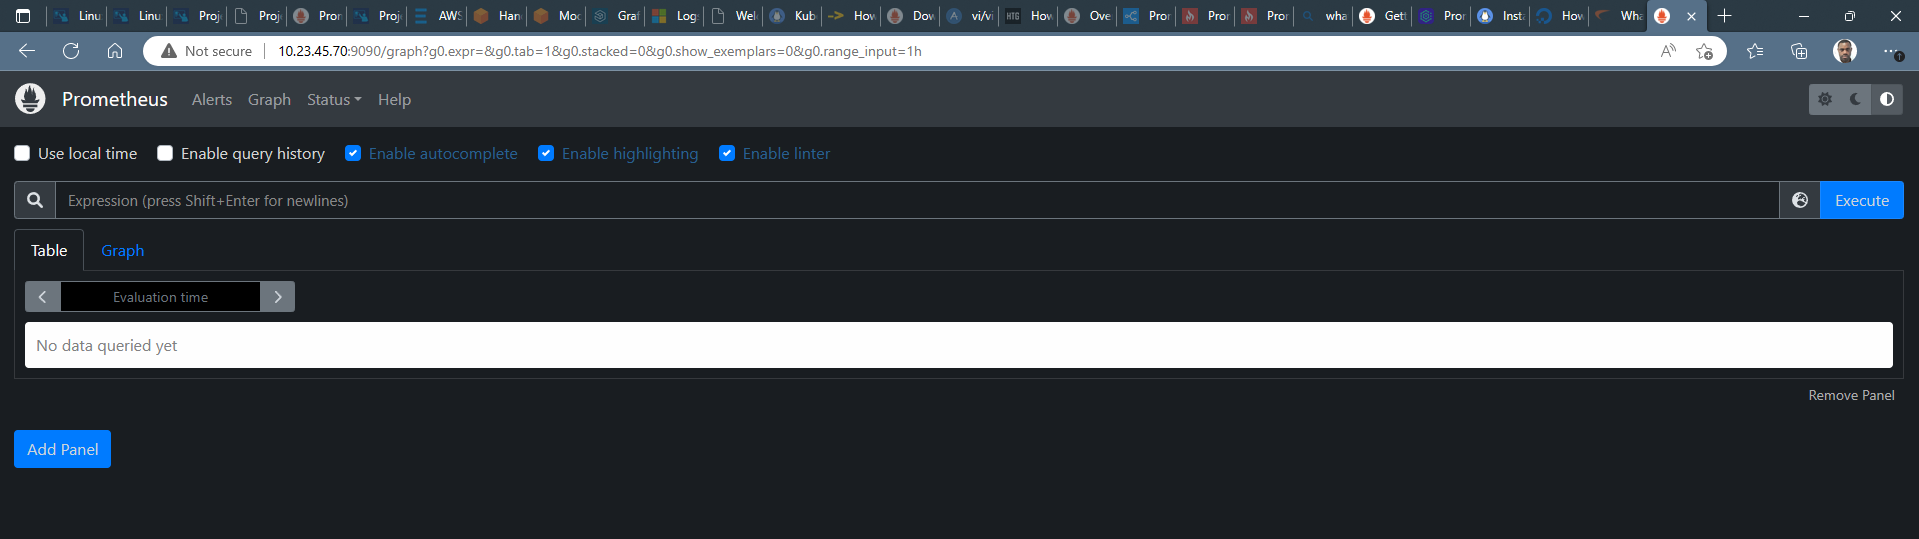
Figure 3 prometheus dashboard
As we can see the Prometheus dashboards, we can also check the target. Click on status then on targets. a screen like the on below will be displayed.
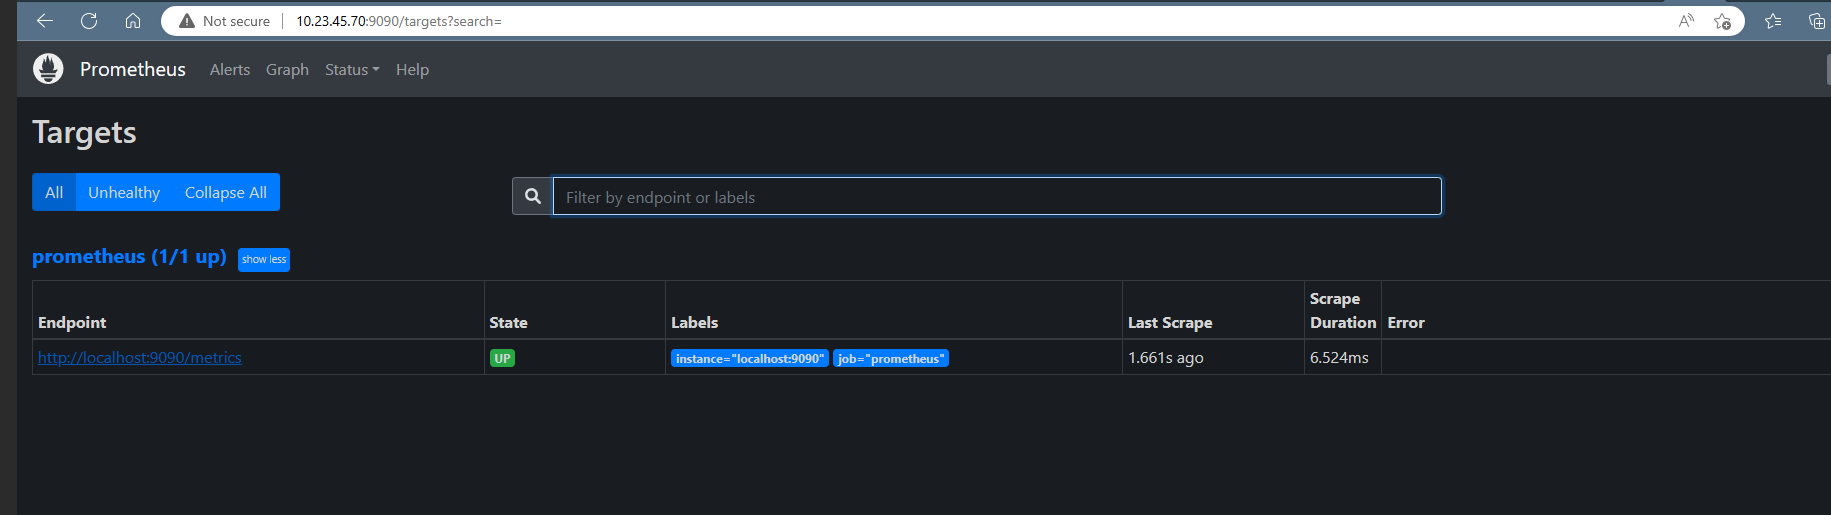
Figure 3 prometheus target
To explore data that Prometheus has collected about itself, you can access Prometheus metrics UI by visiting 10.23.45.70:9090/metrics
As you can gather from "10.23.45.70:9090/metrics", one metric that Prometheus exports about itself is named prometheus_target_interval_length_seconds (the actual amount of time between target scrapes).click on " Graph " tab and Enter the below into the expression console and then click "Execute": A graph like the one below will be display
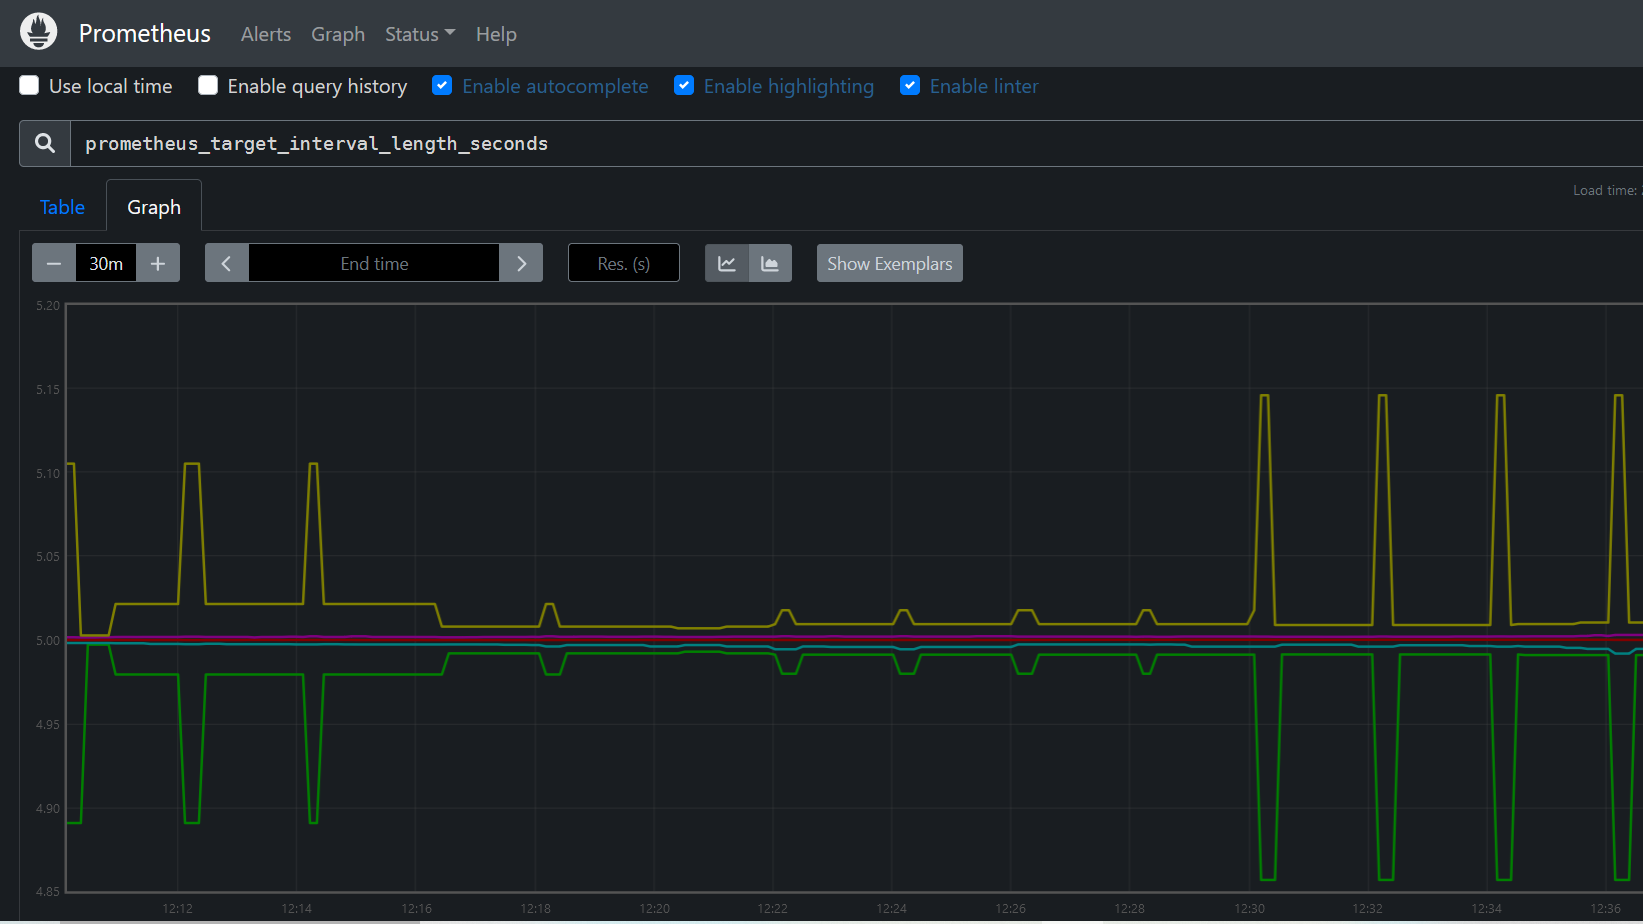
Figure 3 prometheus metrics
To expand Prometheus beyond metrics about itself only, we’ll install an additional exporter called Node Exporter. Node Exporter provides detailed information about the system, including CPU, disk, and memory usage.
Node exporter is responsible for fetching the statistics from various hardware and virtual resources in the format which Prometheus can understand and with the help of the prometheus server those statistics can be exposed on port 9100.
Note:On the target servers, you must install the 'exporter' application that exposes all data and metrics to Prometheus. 'Node Exporter' is a commonly used exporter to monitor Linux machines.
1. Goto Download Page of Prometheus and select the node_exporter-x.xx.x.linux-amd64.tar.gz file for download. (Note- Here x.xx.x is version number)
Download the binary file by runing the command below. Make sure you replace the version with what you sellected
wget https://github.com/prometheus/node_exporter/releases/download/v1.5.0/node_exporter-1.5.0.linux-amd64.tar.gz
Verify it by runing the command ls -lart . When you run the command, you will see the node_exporter file ( node_exporter-1.5.0.linux-amd64 )
Extract the download binary file. (Note- Replace x.xx.x with the downloaded version of node_exporter)
tar xvf node_exporter-1.5.0.linux-amd64.tar.gz
This will create a directory called node_exporter-1.5.0.linux-amd64 containing a binary files named node_exporter a license, and a notice.
Copy the binary to the /usr/local/bin directory and set the user and group ownership to the node_exporter user that you created in Step 1.
sudo cp node_exporter-1.5.0.linux-amd64/node_exporter /usr/local/bin sudo chown node_exporter:node_exporter /usr/local/bin/node_exporter
Lastly, remove the leftover files from your home directory as they are no longer needed.
rm -rf node_exporter-1.5.0.linux-amd64.tar.gz
rm -rf node_exporter-1.5.0.linux-amd64
The steps for running Node Exporter are similar to those for running Prometheus itself. Start by creating the Systemd service file for Node Exporter.
sudo nano /etc/systemd/system/node_exporter.service
This service file tells your system to run Node Exporter as the node_exporter user with the default set of collectors enabled.
Copy the following content into the service file:
[Unit]
Description=Node Exporter
Wants=network-online.target
After=network-online.target
[Service]
User=node_exporter
Group=node_exporter
Type=simple
ExecStart=/usr/local/bin/node_exporter
[Install]
WantedBy=multi-user.target
Save the file and close your text editor.
Reload systemd to use the newly created service.
sudo systemctl daemon-reload
You can now run Node Exporter using the following command:
sudo systemctl start node_exporter
Enable Node Exporter to start on boot.
sudo systemctl enable node_exporter
Verify that Node Exporter’s running correctly with the status command.
sudo systemctl status node_exporter
Like before, this output tells you Node Exporter’s status, main process identifier (PID), memory usage, and more.
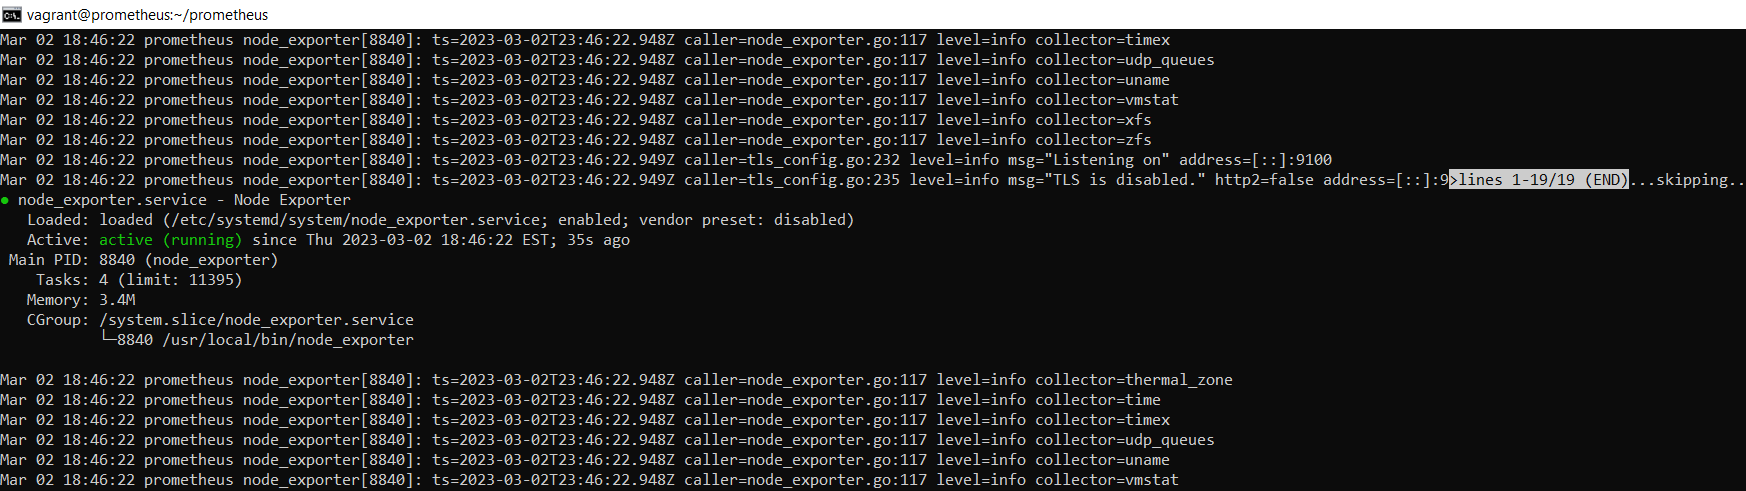
Figure node_exporter
Access the Node exporter metrics on the browser with URL - " http://10.23.45.70:9100"
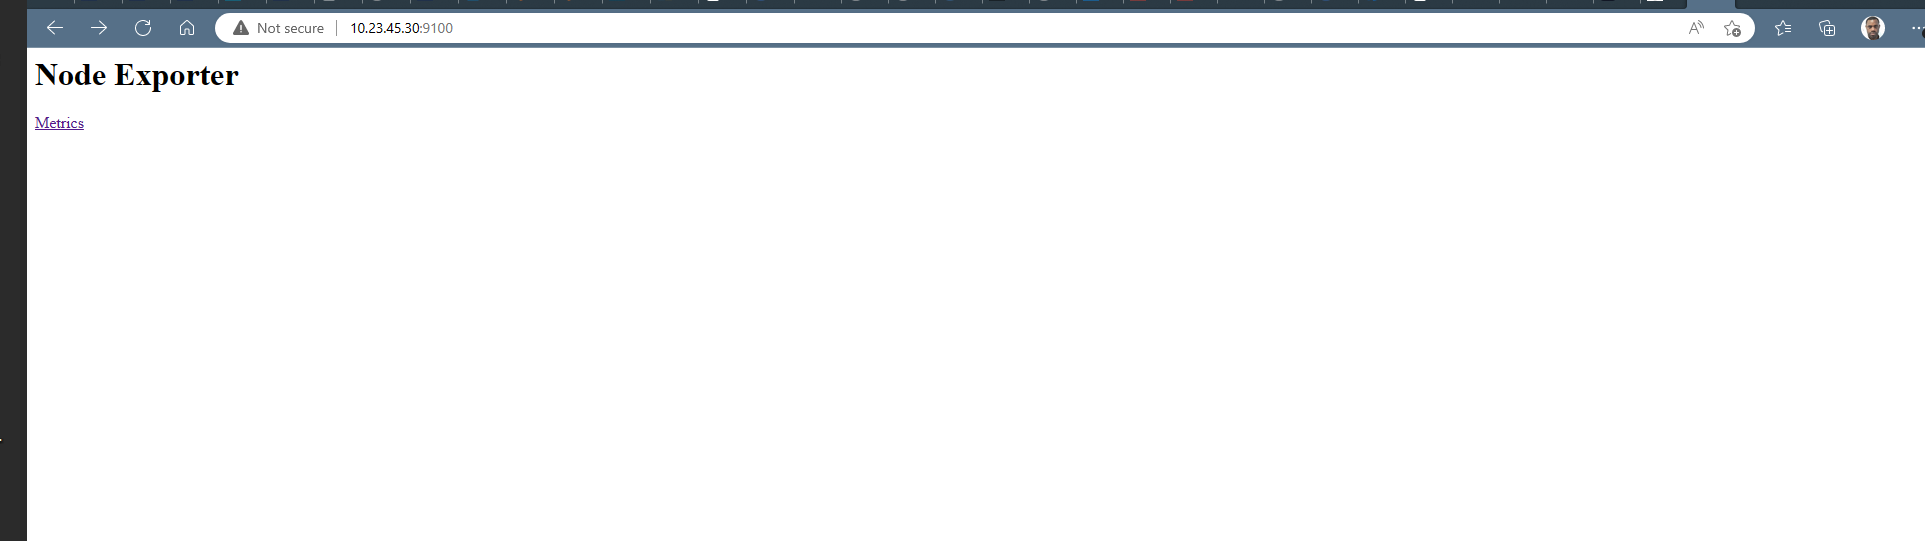
Figure node_exporter dashboard
Because Prometheus only scrapes exporters which are defined in the scrape_configs portion of its configuration file, we’ll need to add an entry for Node Exporter, just like we did for Prometheus itself.
Open the configuration file.
sudo nano /etc/prometheus/prometheus.yml
At the end of the scrape_configs block, add a new entry called node_exporter.
- job_name: 'node_exporter'
scrape_interval: 5s
static_configs:
- targets: ['localhost:9100']
Because this exporter is also running on the same server as Prometheus itself, we can use localhost instead of an IP address again along with Node Exporter’s default port, 9100.
Save the file and exit your text editor when you’re ready to continue.
Restart Prometheus to put the changes into effect.
sudo systemctl restart prometheus
Hit the URL in your web browser to check weather our target is successfully scraped by Prometheus or not
https://10.23.45.70:9090/targets
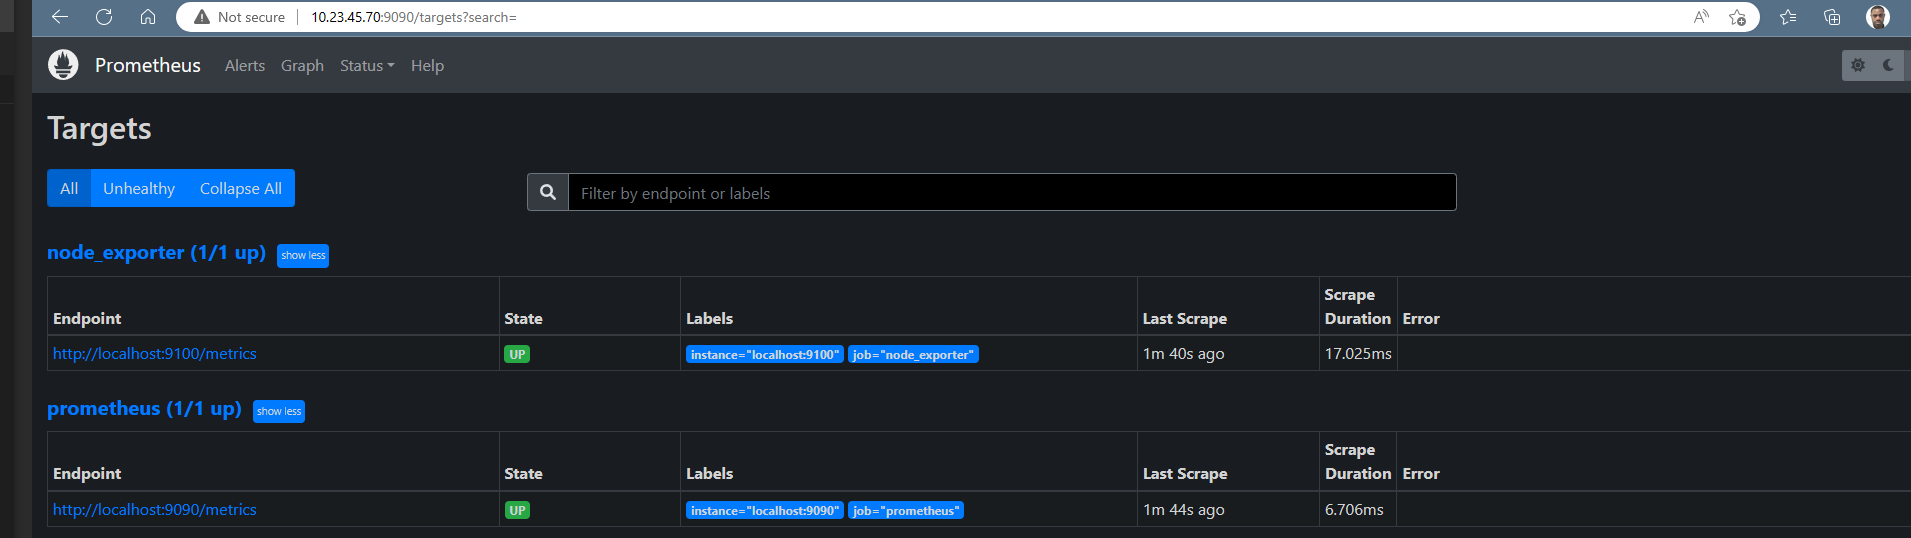
Figure 3 prometheus metrics
We have some servers running in our environment and we will like Node exporter to exposes hardware and kernel-related matrics of these Linux machines.
Now we will configure Prometheus to scrape these new targets. To achieve this, we will add the following job definition to the scrape_configs section in your prometheus.yml and restart your Prometheus instance:
global:
scrape_interval: 15s # By default, scrape targets every 15 seconds.
# Attach these labels to any time series or alerts when communicating with
# external systems (federation, remote storage, Alertmanager).
external_labels:
monitor: 'codelab-monitor'
# A scrape configuration containing exactly one endpoint to scrape:
# Here it's Prometheus itself.
scrape_configs:
# The job name is added as a label `job=` to any timeseries scraped from this config.
- job_name: 'prometheus'
# Override the global default and scrape targets from this job every 5 seconds.
scrape_interval: 5s
static_configs:
- targets: ['localhost:9090']
- job_name: 'node_exporter'
scrape_interval: 5s
static_configs:
- targets: ['10.23.45.30:9100','localhost:9100']
- job_name: 'grafana'
scrape_interval: 5s
static_configs:
- targets: ['10.23.45.40:3000']
Hit the URL in your web browser to check weather our target is successfully scraped by Prometheus or not
https://10.23.45.70:9090/targets
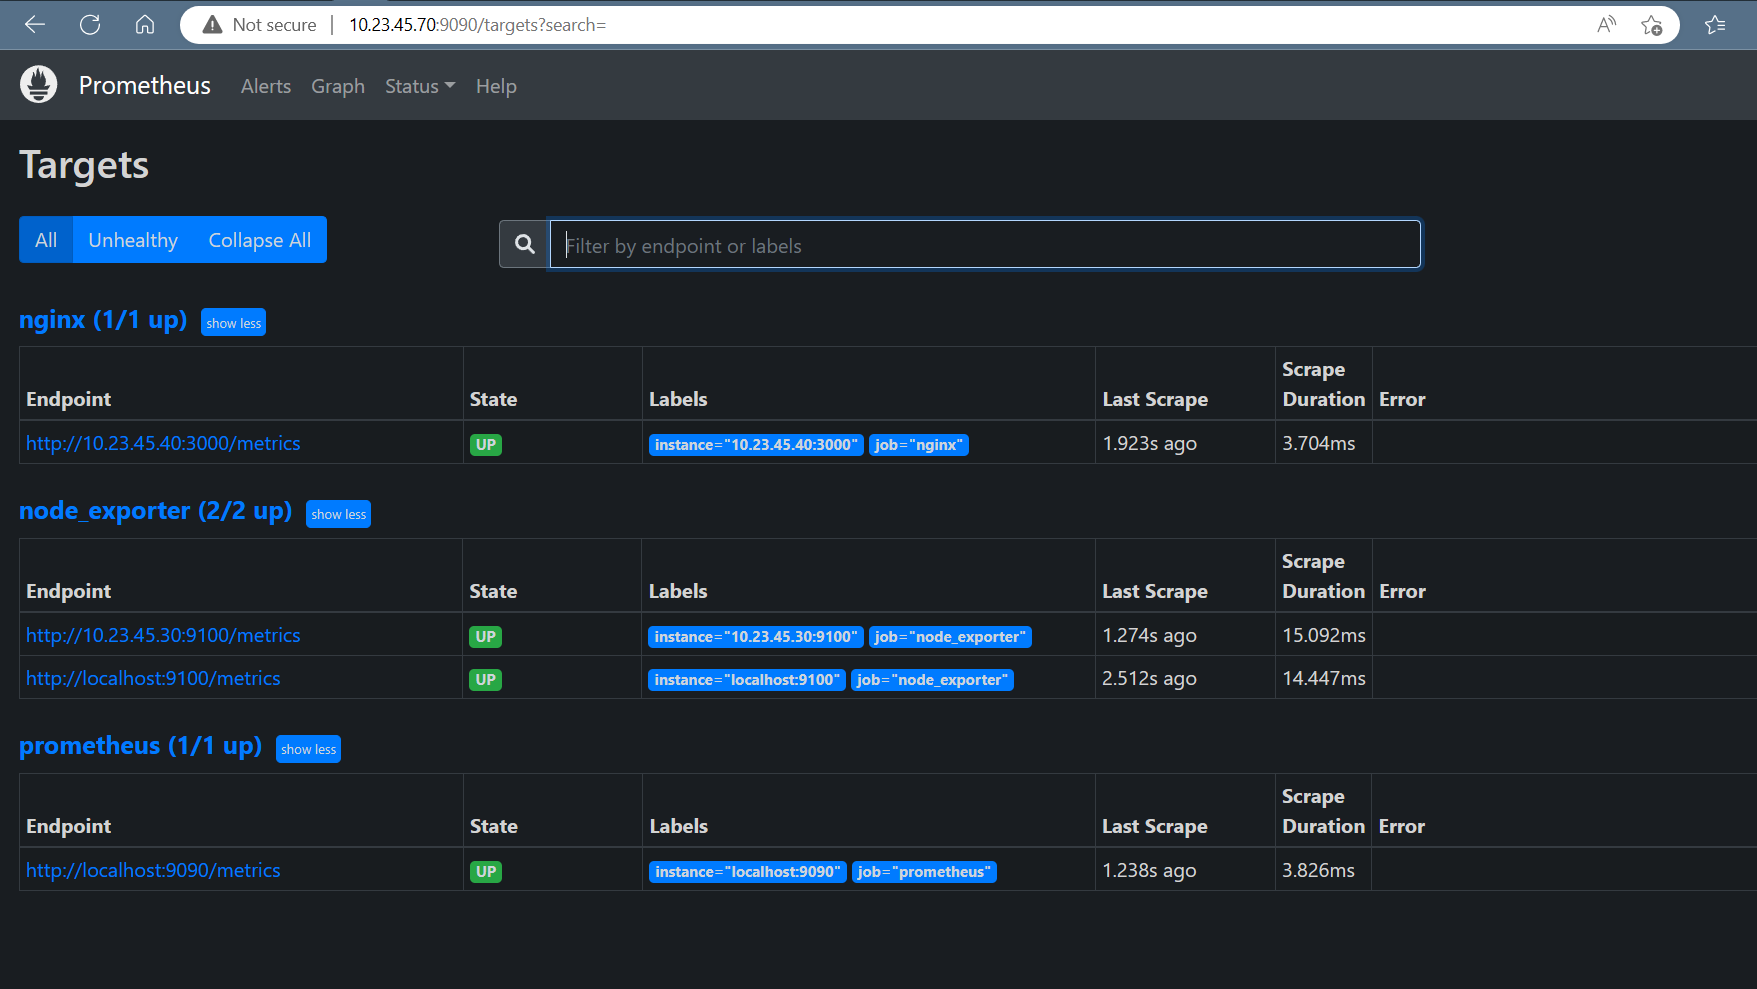
Figure prometheus metrics
Let's install Grafana, so we can create dashboards and graphs using prometheus as our source.
sudo dnf install -y https://dl.grafana.com/oss/release/grafana-7.2.0-1.x86_64.rpm
Click on the link to Check other methods of installation : https://grafana.com/docs/grafana/latest/setup-grafana/installation/rpm/
Now you're ready to start and enable the grafana-server service.
sudo systemctl start grafana-server
sudo systemctl enable grafana-server
Open a web browser and connect to http://10.23.45.70:3000 . Log in with the username of "admin" and the password of "admin."
You'll be prompted to change your password, but simply click on "Skip" for now
Once you logged into Grafana Now first Navigate to Settings Icon ->> Configuration ->> data sources
Click on the "Add data sources" button. then on prometheus
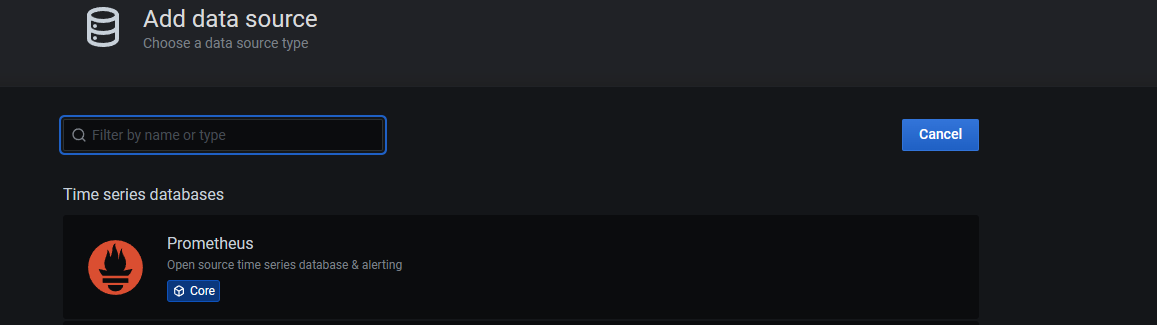
Figure prometheus metrics
Enter the required details such as where Promethueus is running at and so on. You can give it a name you prefer as well.
Previous Next
The goal for this project is to create a centralized syslog server that will allow you to store, graph, and search through the syslog messages from multiple servers. To do this, you'll be deploying the ELK stack. The components of the ELK stack are Elasticsearch, Logstash, and Kibana. Finally, you'll configure servers to send their messages to this new system.
The ELK Stack fulfills a need in the log analytics space. As more and more of your IT infrastructure move to public clouds, you need a log management and analytics solution to monitor this infrastructure as well as process any server logs, application logs, and clickstreams. The ELK stack provides a simple yet robust log analysis solution for your developers and DevOps engineers to gain valuable insights on failure diagnosis, application performance, and infrastructure monitoring – at a fraction of the price.
In computing, logging is the act of keeping a log of events that occur in a computer system, such as problems, errors or just information on current operations. These events may occur in the operating system or in other software. A message or log entry is recorded for each such event. These log messages can then be used to monitor and understand the operation of the system, to debug problems, or during an audit. Logging is particularly important in multi-user software, to have a central overview of the operation of the system.
In the simplest case, messages are written to a file, called a log file. Alternatively, the messages may be written to a dedicated logging system or to a log management software, where it is stored in a database or on a different computer system.
Syslog is the de facto UNIX networked logging standard, sending messages from client machines to a local file, or to a centralized log server via rsyslog.
Linux has a dedicated service known as Syslog that is specifically responsible for creating logs via the System Logger. Syslog comprises of several components such as the Syslog Message Format, Syslog Protocol, and the Syslog Daemon: popularly known as syslogd or rsyslogd in newer versions of Linux.
The syslog protocol provides a message format defined by the RFC 5424 standard. In this format, common event information is defined, such as the timestamp, hostname, and the name of the application that produced the message. To further support the structuring of this message, syslog facilities are available to denote which part of the system the log comes from. This is done by attaching a number to the message. Below is a list of all available facilities, numbered from 0 to 23:
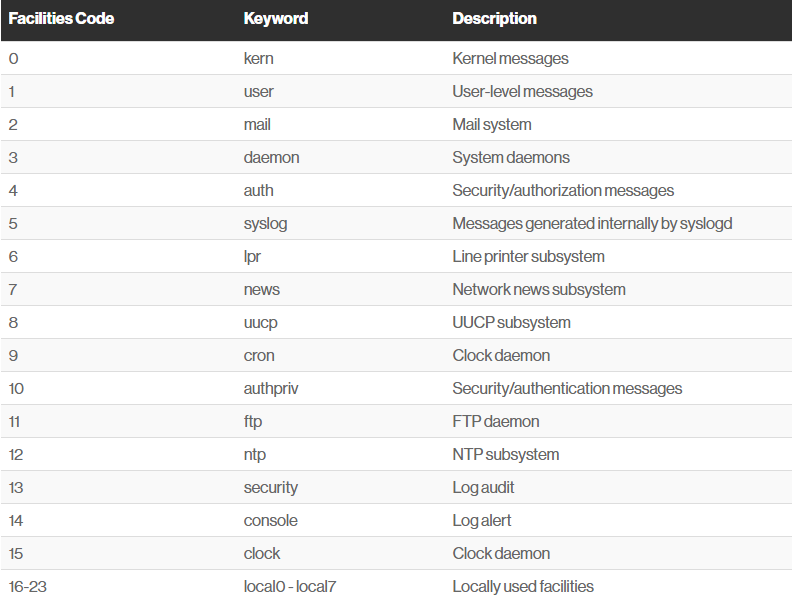
Figure syslog facilities
Similarly, priority can be attached to a message using a number between 0 and 7
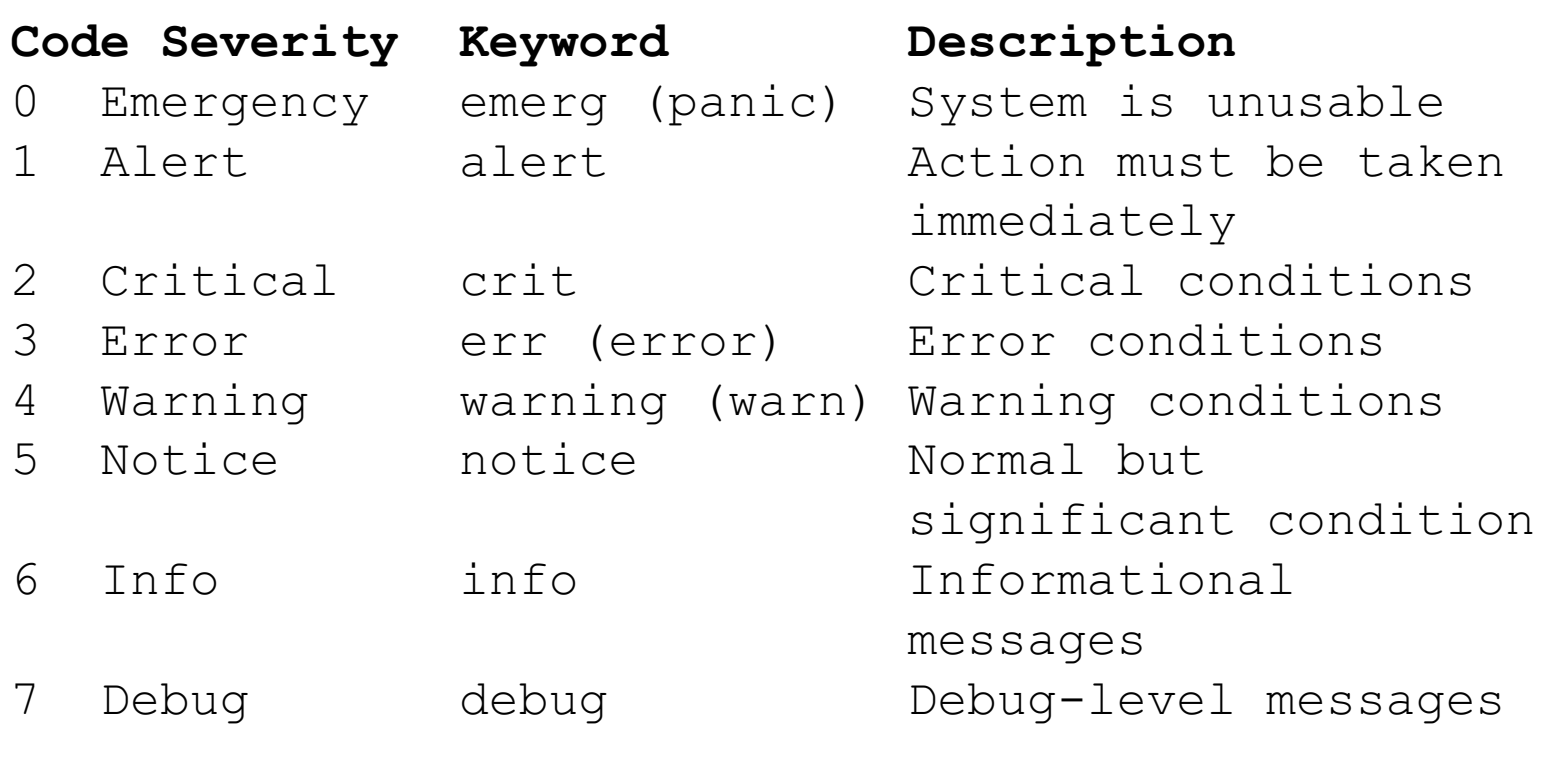
Figure syslog priority
The syslog process runs as a daemon on the system to receive, store, and interpret syslog messages from other services or applications. That service typically listens on port 514 for TCP and 601 for UDP connections. Many applications allow you to configure their event logging to push messages to a running syslog service.
The rsyslog daemon runs as a service on your host, listening for log messages sent to it and routing those messages based on defined actions.
In a typical installation of rsyslog, the daemon is configured through a file located at /etc/rsyslog.conf . In this config file, using selectors for the facilities and priority of the log message allows you to define what action should be carried out for the message.
In the following example, any messages with the facility of mail and a priority of notice or higher will be written to a log file located at /var/log/mail_errors.
                                                                                    1. # .
                                                                                    2. mail.notice /var/log/mail_errors
These selectors are structured by facility (origin of the message) and priority (severity of the message), separated by a dot. The example below shows some possibilities of using this simple configuration to perform actions on incoming logs.
# Log a message to file
                                                      mail.notice /var/log/mail_errors


                                                      # Log a message to a user


                                                      Kern.debug bob
                                                      # Emergency messages from any facility should go to all users
                                                      *.emerg *


                                                      # Log a message to another host over UDP
                                                      *.* @remote-host


                                                      # Log a message to another host over TCP
                                                      *.* @@remote-host:514
let’s see a couple of utilities that you can use in case you want to log messages.
The logger utility is probably one of the simpliest log client to use. Logger is used in order to send log messages to the system log and it can be executed using the following syntax.
$ logger Let’s say for example that you want to send an emergency message from the auth facility to your rsyslog utility, you would run the following command.
logger -p auth.emerg "Somebody tried to connect to the system"
Now if you were to inspect the /var/log/auth.log file, you would be able to find the message you just logged to the rsyslog server.
$ tail -n 10 /var/log/auth.log | grep --color connectIn a system that generates several logs, the administration of such files can be greatly simplified using logrotate. it will automatically rotate, compress, remove, and mail logs on a periodic basis or when the file reaches a given size.
A syslog server is where system logs are centralized, making it easier to manage and monitor them. Syslog servers allow you to collect your error logs and system logs in one place, and you can coordinate and combine logs from across different systems.
Centralizing logs in one place is ensential. Doing so can benefit you in the following ways
We will create a centralized rsyslog server to store log files from multiple systems and then use Logstash to send them to an Elasticsearch server. From there, will use Kibana to analyze the data.
From a centralized, or aggregating rsyslog server, you can then forward the data to Logstash, which can further parse and enrich your log data before sending it on to Elasticsearch.
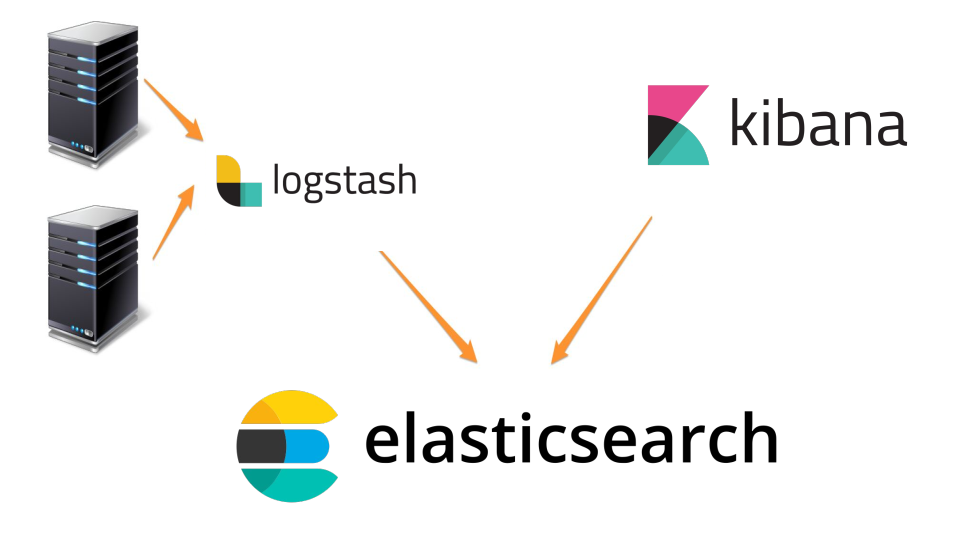
Figure Centralized syslog system
The ELK stack is an acronym used to describe a stack that comprises of three popular projects: Elasticsearch, Logstash, and Kibana. Often referred to as Elasticsearch, the ELK stack gives you the ability to aggregate logs from all your systems and applications, analyze these logs, and create visualizations for application and infrastructure monitoring, faster troubleshooting, security analytics, and more.
Logstash is a light-weight, open-source, server-side data processing pipeline that allows you to collect data from a variety of sources, transform it on the fly, and send it to your desired destination. It is most often used as a data pipeline for Elasticsearch, an open-source analytics and search engine. Because of its tight integration with Elasticsearch, powerful log processing capabilities, and over 200 pre-built open-source plugins that can help you easily index your data, Logstash is a popular choice for loading data into Elasticsearch.
Logstash allows you to easily ingest unstructured data from a variety of data sources including system logs, website logs, and application server logs.
Elasticsearch is a distributed search and analytics engine built on Apache Lucene. Since its release in 2010, Elasticsearch has quickly become the most popular search engine and is commonly used for log analytics, full-text search, security intelligence, business analytics, and operational intelligence use cases.
you can send data in the form of JSON documents to Elasticsearch using the API or ingestion tools such as Logstash and Amazon Kinesis Firehose. Elasticsearch automatically stores the original document and adds a searchable reference to the document in the cluster’s index. You can then search and retrieve the document using the Elasticsearch API. You can also use Kibana, a visualization tool, with Elasticsearch to visualize your data and build interactive dashboards.
Kibana is a data visualization and exploration tool used for log and time-series analytics, application monitoring, and operational intelligence use cases. It offers powerful and easy-to-use features such as histograms, line graphs, pie charts, heat maps, and built-in geospatial support. Also, it provides tight integration with Elasticsearch, a popular analytics and search engine, which makes Kibana the default choice for visualizing data stored in Elasticsearch.
The ELK Stack fulfills a need in the log analytics space. As more and more of your IT infrastructure move to public clouds, you need a log management and analytics solution to monitor this infrastructure as well as process any server logs, application logs, and clickstreams. The ELK stack provides a simple yet robust log analysis solution for your developers and DevOps engineers to gain valuable insights on failure diagnosis, application performance, and infrastructure monitoring – at a fraction of the price.
The vagrant box: "jasonc/centos8" will be use to boot up this machine.
Open the command prompt or terminal and create a project directory with the command below.
mkdir linuxclass Move into the folder or directory we just created by runing the command:
cd linuxclassInitialize the vagrant project using the usual process of creating a directory, changing into that directory, and running "vagrant init". We'll name this vagrant project "elk_stack".
                                                                                      mkdir elkstack
                                                                                      cd elkstack
                                                                                      vagrant init jasonc/centos8
open and modified the vagrantfile by adding a hostname and an IP address to the server as seen below
                                                                                        config.vm.hostname = "elkstack"
                                                                                        config.vm.network "private_network", ip: "10.23.45.90"
Boot up the virtual machine, check the status and ssh into the machine with the following command>
                                                                                      vagrant up
                                                                                      vagrant status
                                                                                      vagrant ssh
We'll be using Elasticsearch to store the syslog messages. Let's install Elasticsearch from an RPM.
Before you install Elasticsearch, run the command below to install java in centos8
sudo dnf install java-11-openjdk-develAll packages are signed with the Elasticsearch signing key in order to protect your system from package spoofing. Packages which have been authenticated using the key will be considered trusted by your package manager. In this step, you will import the Elasticsearch public GPG key and add the Elastic package source list in order to install Elasticsearch.
Execute the following command on command line or terminal to import GPG key in centOS 8:
sudo rpm --import https://artifacts.elastic.co/GPG-KEY-elasticsearchFirst, Open text editor and create the repository file the /etc/yum.repos.d by executing the following command on command line or terminal:
sudo nano /etc/yum.repos.d/elasticsearch.repoThen paste the following content into the file, save and exit:
                                                        [elasticsearch-7.x]
                                                        name=Elasticsearch repository for 7.x packages
                                                        baseurl=https://artifacts.elastic.co/packages/7.x/yum
                                                        gpgcheck=1
                                                        gpgkey=https://artifacts.elastic.co/GPG-KEY-elasticsearch
                                                        enabled=1
                                                        autorefresh=1
                                                        type=rpm-md
And your repository is ready for use. You can now install Elasticsearch with this commands:
sudo dnf install elasticsearch We need to give our Elasticsearch cluster a name. Also, let's use our hostname for the node name. Edit the elasticsearch.yml file.
sudo nano /etc/elasticsearch/elasticsearch.yml Append the following contents to the bottom of the file and save it.
                                                                                  cluster.name: elkstack
node.name: elkstack Reboot the system for the changes to take effect:
sudo rebootNow we can start and enable the Elasticsearch service.
                                                        sudo systemctl start elasticsearch.service
                                                        sudo systemctl enable elasticsearch.service
Execute the following command on command line or terminal to view the Elasticsearch server configuration and version details:
Give Elasticsearch a minute or two to start. Then connect to its port of 9200 over HTTP using curl.
curl http://localhost:9200 or curl -X GET "localhost:9200"
                                                        {
                                                          "name" : "elkstack",
                                                          "cluster_name" : "elkstack",
                                                          "cluster_uuid" : "gYkxAAbcSdqQ53ZJws3tAQ",
                                                          "version" : {
                                                            "number" : "7.17.9",
                                                            "build_flavor" : "default",
                                                            "build_type" : "rpm",
                                                            "build_hash" : "ef48222227ee6b9e70e502f0f0daa52435ee634d",
                                                            "build_date" : "2023-01-31T05:34:43.305517834Z",
                                                            "build_snapshot" : false,
                                                            "lucene_version" : "8.11.1",
                                                            "minimum_wire_compatibility_version" : "6.8.0",
                                                            "minimum_index_compatibility_version" : "6.0.0-beta1"
                                                          },
                                                          "tagline" : "You Know, for Search"
                                                        }
Let's install Logstash, so we have a way of receiving logs from systems and sending them to Elasticsearch. Logstash is a Java application,so we'll need to install Java. we already install java
Like other parts of the ELK stack, Logstash uses the same Elastic GPG key and repository.
To install logstash on CentOS 8, in a terminal window enter the command:
sudo dnf install logstash Type Y and hit Enter to confirm the install.
Let's create the Logstash configuration. We'll place it in a file named elkstack.conf the /etc/logstash/conf.d directory.
sudo nano /etc/logstash/conf.d/elkstack.confPaste the following contents into the file and save it. Be sure that all the characters pasted correctly. it should apears as seen below
                                                          input {
                                                            syslog {
                                                              type => syslog
                                                              port => 5141
                                                            }
                                                          }
                                                          filter {
                                                            if [type] == "syslog" {
                                                              grok {
                                                                match => { "message" => "Accepted %{WORD:auth_method} for %{USER:username} from %{IP:src_ip} port %{INT:src_port} ssh2" }
                                                                add_tag => "ssh_successful_login"
                                                                }
                                                              grok {
                                                                match => { "message" => "Failed %{WORD:auth_method} for %{USER:username} from %{IP:src_ip} port %{INT:src_port} ssh2" }
                                                                add_tag => "ssh_failed_login"
                                                              }
                                                              grok {
                                                                match => { "message" => "Invalid user %{USER:username} from %{IP:src_ip}" }
                                                                add_tag => "ssh_failed_login"
                                                              }
                                                            }
                                                            geoip {
                                                              source => "src_ip"
                                                            }
                                                          }
                                                          output {
                                                            elasticsearch { }
                                                          }
The input section of the configuration causes Logstash to listen for syslog messages on port 5141. The filter section of the configuration allows Logstash to perform a bit of processing on the messages it receives that match the given patterns. For example, it extracts the authentication method, the username, the source IP address, and source port for ssh connection attempts. It also tags the messages with "ssh_successful_login" or "ssh_failed_login". This will make searching for data based on username, IP address, failed ssh login attempts, etc, quick and efficient. The output section tells logstash to store the messages into the Elasticsearch instance we just created.
Now we can start and enable the logstash service.
                                                            sudo systemctl start logstash
                                                            sudo systemctl enable logstash
Logstash can take several seconds to start. You can confirm it started by looking at its log file.
cat /var/log/logstash/logstash-plain.log Next, let's configure our local system to forward its syslog messages to Logstash. To do that, let's create a logstash.conf file in the /etc/rsyslog.d
sudo nano /etc/rsyslog.d/logstash.conf Place the following contents in the file and save the file.
*.* @10.23.45.90:5141This will cause rsyslog to send a copy of every syslog message to Logstash. Restart rsyslog to enable this configuration.
sudo systemctl restart rsyslogLogstash should now be receiving syslog messages from the local system and storing them in Elasticsearch. Let's look at the Elasticsearch indices. You should see an index for Logstash like the one below.
curl http://localhost:9200/_cat/indices?v
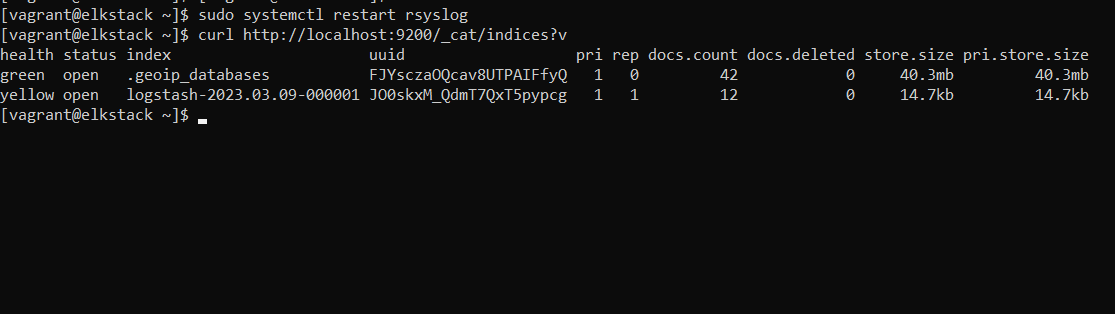
Figure logstash index
Over time, Logstash will create more indices in Elasticsearch. You'll be able to search across those indices without a problem with Kibana, which you will be installing in a minute.
Creating a Cluster - For Informational Purposes Only - (OPTIONAL)
You see that the health of the index is yellow, it's because there is only one copy of the data for that index, and it's stored on this host. For this project, we are going to operate with one copy of our data.
At the end of this project, we will show you how to add and configure another node If you want to eliminate single points of failure for your Elasticsearch cluster in a production environment,
Elasticsearch can consume a lot of memory. If you are experiences issues, increase the amount of memory allocated to the virtual machine to at least 3 GB if possible. You can do this with a config.vm.provider block of configuration. Update your Vagrantfile to look like the following:
                                                      Vagrant.configure("2") do |config|
                                                      config.vm.box = "jasonc/centos8"
                                                      config.vm.hostname = "elkstack"
                                                      config.vm.network "private_network", ip: "10.23.45."90
                                                      config.vm.provider "virtualbox" do |vb|
                                                      vb.memory = "3072"
                                                      end
                                                      end
Kibana uses the same GPG key as Elasticsearch, so you don’t need to re-import the key. Additionally, the Kibana package is in the same ELK stack repository as Elasticsearch. Hence, there is no need to create another repository configuration file.
To install Kibanra, open a terminal window, enter the following:
sudo dnf install -y kibana By default, Kibana only listens on localhost. This means that you would not be able to connect to Kibana from outside the host. Let's change that so we can access Kibana using the VM's IP address. Open up the Kibana configuration file for editing.
sudo nano /etc/kibana/kibana.yml Add this line of configuration.
server.host: "10.23.45.90"Now that we've configured Kibana, it's time to start it. We'll also enable it so that it starts on boot as well.
                                                        sudo systemctl start kibana
                                                        sudo systemctl enable kibana
Once Kibana has been started, open a web browser on your local machine and visit this address: http://10.23.45.90:5601. Kibana operates on port 5601, so that's the port you'll connect to. It can take Kibana a few minutes to start, so please be patient.
You'll be presented with a welcome screen. Click on the "Explore on my own" link
<>
In the upper-left corner click on the menu icon.

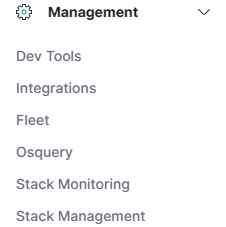
Scroll down. Under the "Management" section, click the "Stack Management" link.
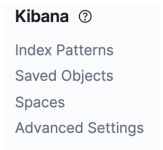
Scroll down. Under the "Kibana" section, click the "Index Patterns" link.
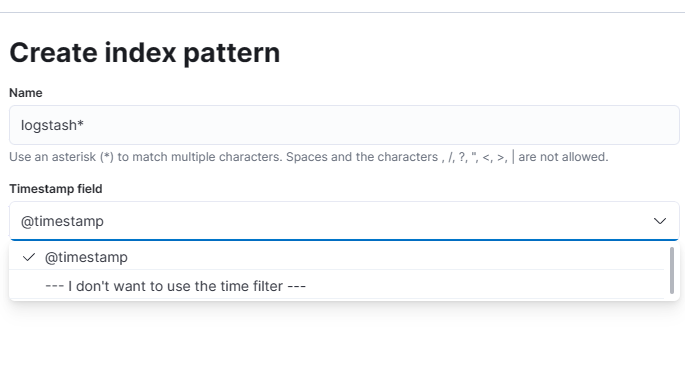
Now click on the "Create index pattern" button.

In the "Index pattern name" field, enter "logstash*" . This tells Kibana to use any indices in Elasticsearch that start with "logstash".
In the "Time Field" dropdown menu, select "@timestamp". Your screen should look like the one below. Then click the "Create index pattern" button.
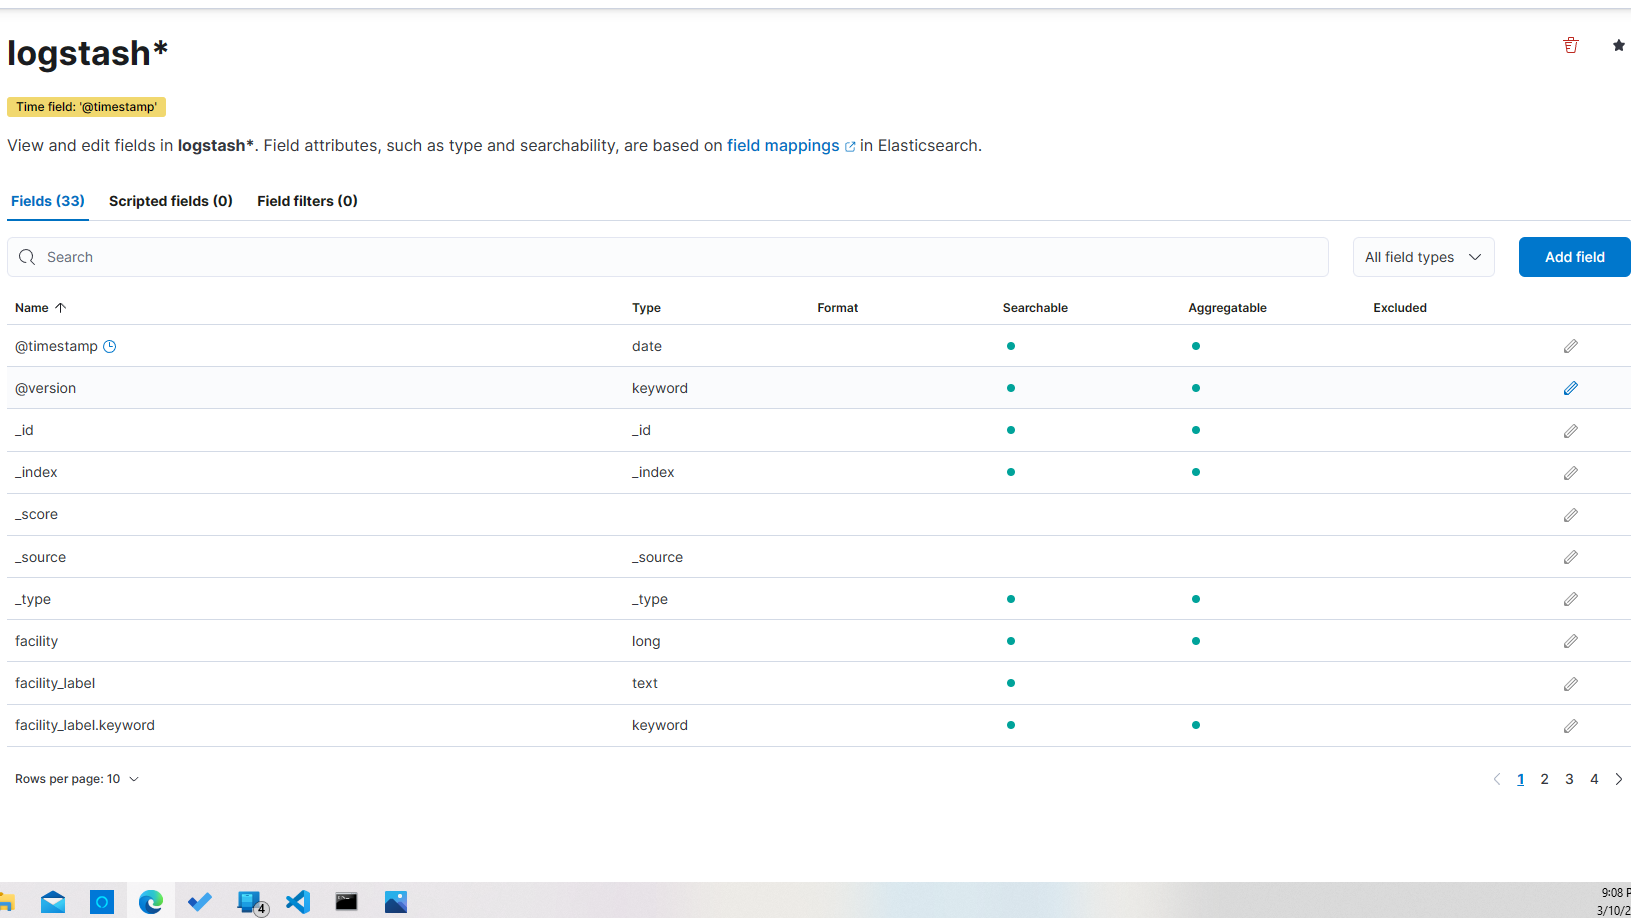
You'll be brought to a screen that shows information about the index pattern that you just created.
Now you can start searching for log messages by clicking on the "Discover" link under "Analytics" in the right-hand menu.

Return to your command line session. Let's use the logger command to send a message to syslog. Of course, this message will be sent to Logstash as well, and will ultimately be stored in Elasticsearch. Here is the command:
logger "testing sudo search" This will send a syslog message of "testing sudo search". You can see it in /var/log/messages.
sudo grep testing /var/log/messagesNow, return to Kibana (http://10.23.45.90:5601/app/discover#/) perform a search for "sudo". This returns all results that have the text "sudo" anywhere in its associated record. Here's an example that shows the word "sudo" in the "message" field of the record -- the one we created with the logger command.
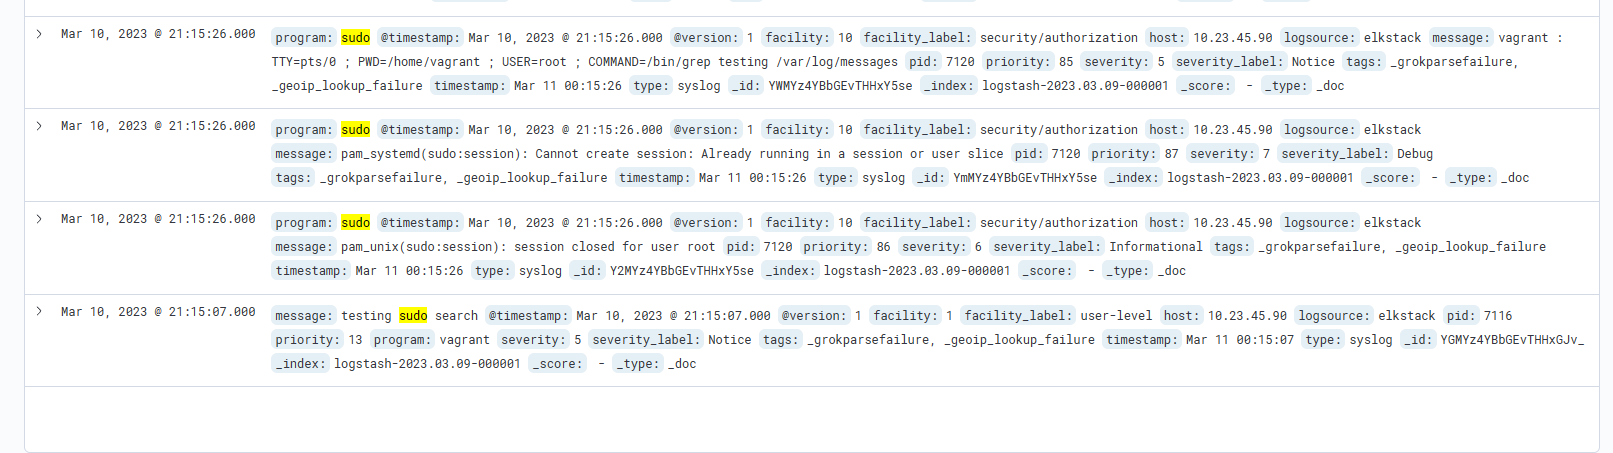
You'll notice the various parts of the record. There is the message, the timestamp, the type, host, program, etc. You can use each one of these fields to narrow your search results. For example, let's search for sudo, but let's only display results that come from the sudo program. To do that, type in the search string "program:sudo". then click on "update" at the far top right
Now we'll only get syslog messages generated by the sudo command. You will not find the message generated by the logger command used earlier, even though the word "sudo" was in the message. (For that, you could use this search: "message:sudo")
If you want to display all matches, simply enter in "*" in the search bar and hit enter.
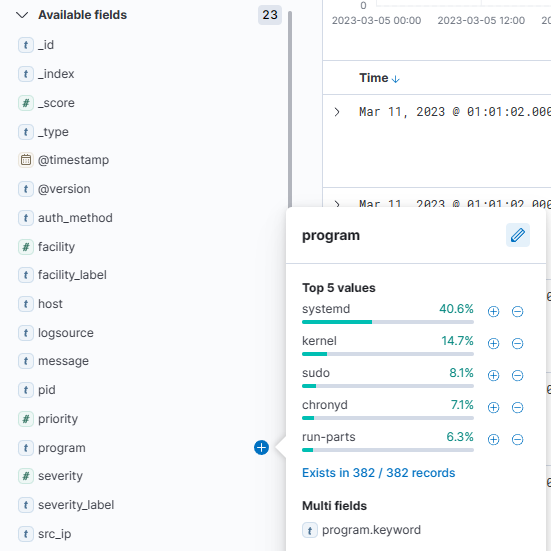
You can explore the data that is available in the fields by clicking on them on the left side of your screen. For example, if you click on "program" you'll see data that matches that field.
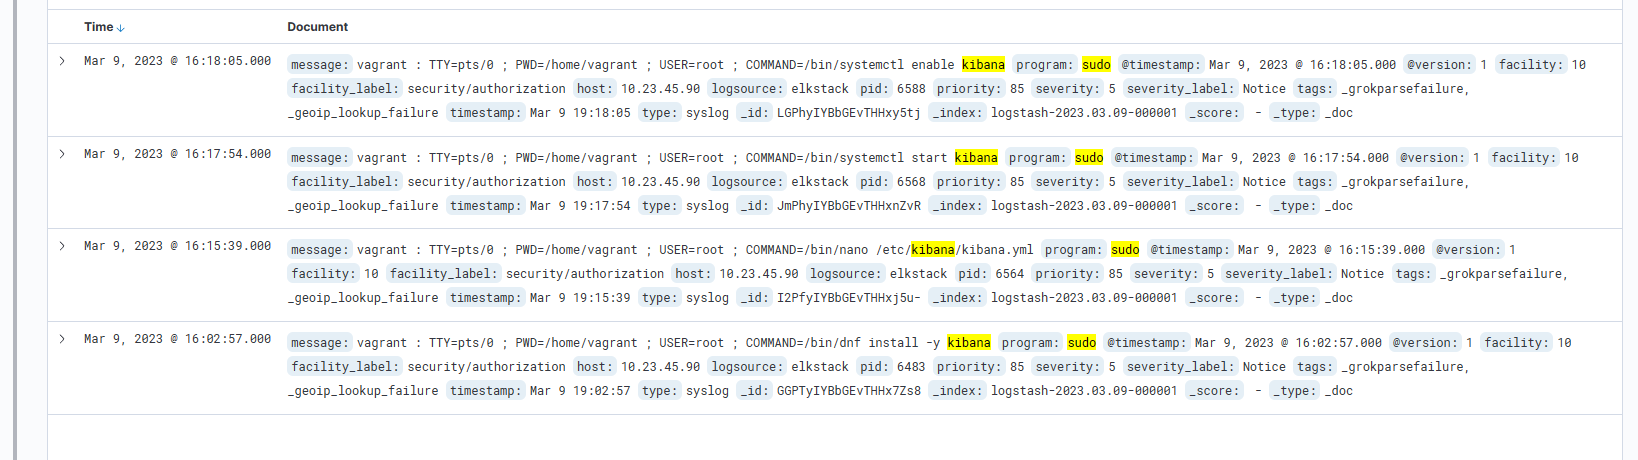
Let's do another search. This time, let's look for syslog messages generated by the sudo command that also contain the keyword "kibana." To do that, we'll use "AND" in our search. If you don't include "AND", Kibana will return results that match either of the conditions.
Here is the search: "program:sudo AND kibana". This is an example match that shows where the vagrant user ran "systemctl enable kibana".
Now let's create a graph. First, let's get some data to graph. Return to the command line and log out of the system and back in again a few time. This will create log entries for each of your connections.
                                                      exit
                                                      vagrant ssh
                                                      exit
                                                      vagrant ssh
                                                      exit
                                                      vagrant ssh